Dashboards · React
API monitoring
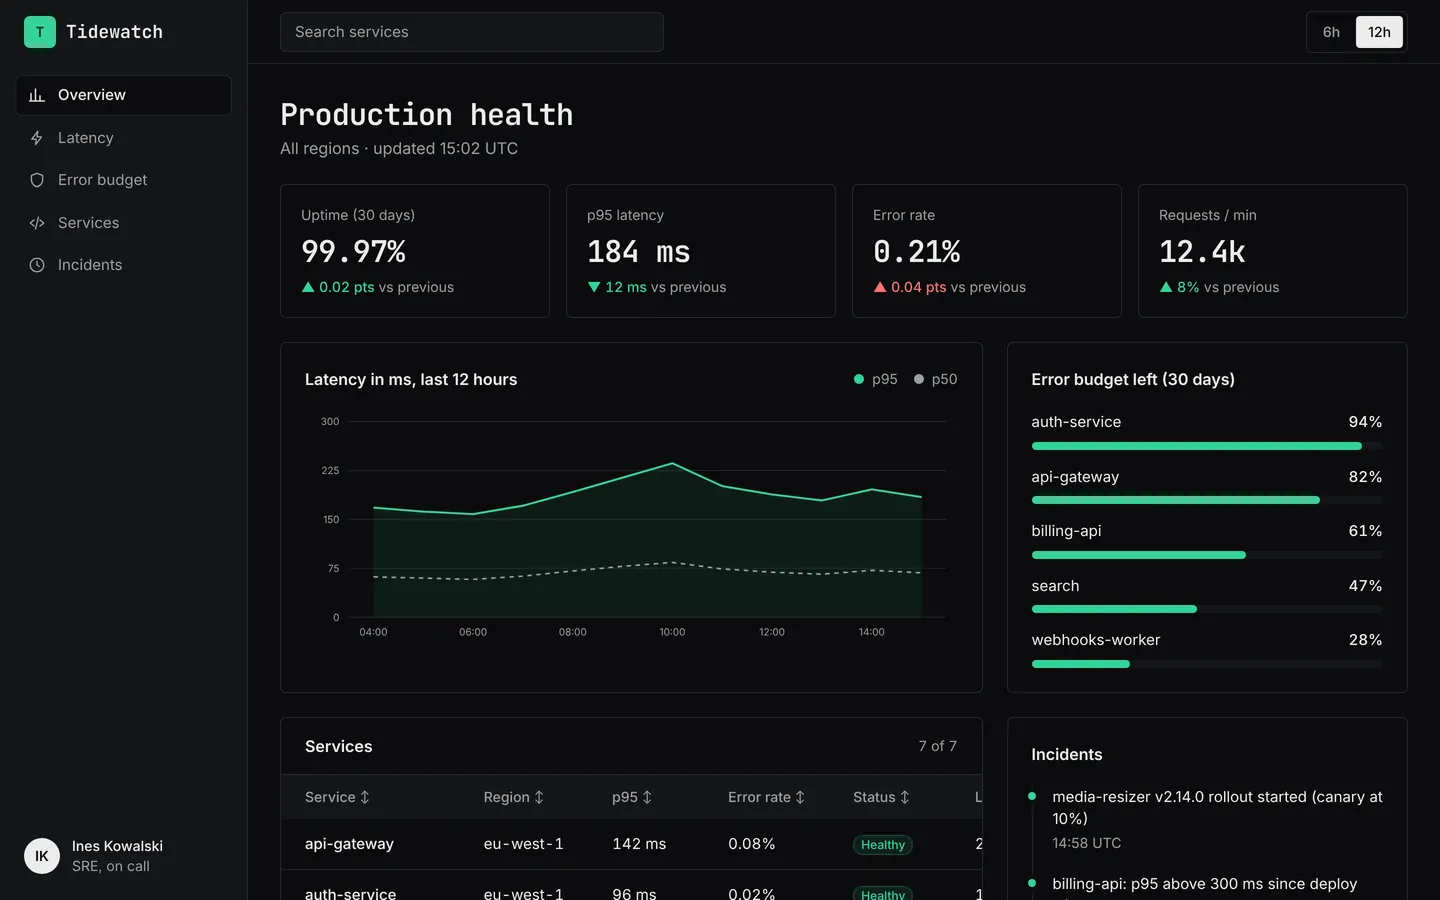
Latency, error rates, uptime and service health for an API platform, in a dark on-call layout.
What you get
A dark monitoring dashboard for an engineering team on call: p50 and p95 latency over the last 12 hours, error budget left per service, service health with latest deploys, and an incident timeline. Services and metrics live in src/dashboard.ts.
Files
Exactly what is copied into a new project: 13 files, nothing generated.
Explorer 13
@import "tailwindcss"; /* Theme: change these to restyle the whole site. */@theme { --color-bg: #0b0c0d; --color-surface: #131517; --color-fg: #ececec; --color-muted: #9a9fa5; --color-line: #24272b; --color-accent: #34d399; --color-accent-fg: #052e1f; --color-good: #34d399; --color-warn: #fbbf24; --color-bad: #f87171; --font-heading: "JetBrains Mono", ui-monospace, SFMono-Regular, Menlo, monospace; --font-body: "Inter", ui-sans-serif, system-ui, -apple-system, "Segoe UI", Roboto, sans-serif; --radius-card: 6px;} html { color-scheme: dark; scroll-behavior: smooth; background: var(--color-bg);} body { font-family: var(--font-body); -webkit-font-smoothing: antialiased; text-rendering: optimizeLegibility;} ::selection { background: color-mix(in srgb, var(--color-accent) 22%, transparent);}Remix
Remix this template
Describe what to change and the agent starts from API monitoring's files. The box is already started for you: finish “Start from API monitoring and …”
Dependencies
Documented from the template's package.json. The runtime has a prebuilt dependency set for Vite + React + TypeScript, so installs are fast.
- react^19.1.0
- react-dom^19.1.0
- vite^6.3.0
- @vitejs/plugin-react^4.4.0
- tailwindcss^4.1.0
- @tailwindcss/vite^4.1.0
- typescript^5.8.0
How it runs
- Framework
- Vite + React + TypeScript
- Dev command
- npm run dev
- Build command
- npm run build
- Output directory
- dist
- Port
- 5173
- Entry route
- /
Projects run in an isolated sandbox with a live preview. Read the projects documentation for settings, snapshots and deployment.
Keep browsing
All templates- Featured
Analytics dashboard
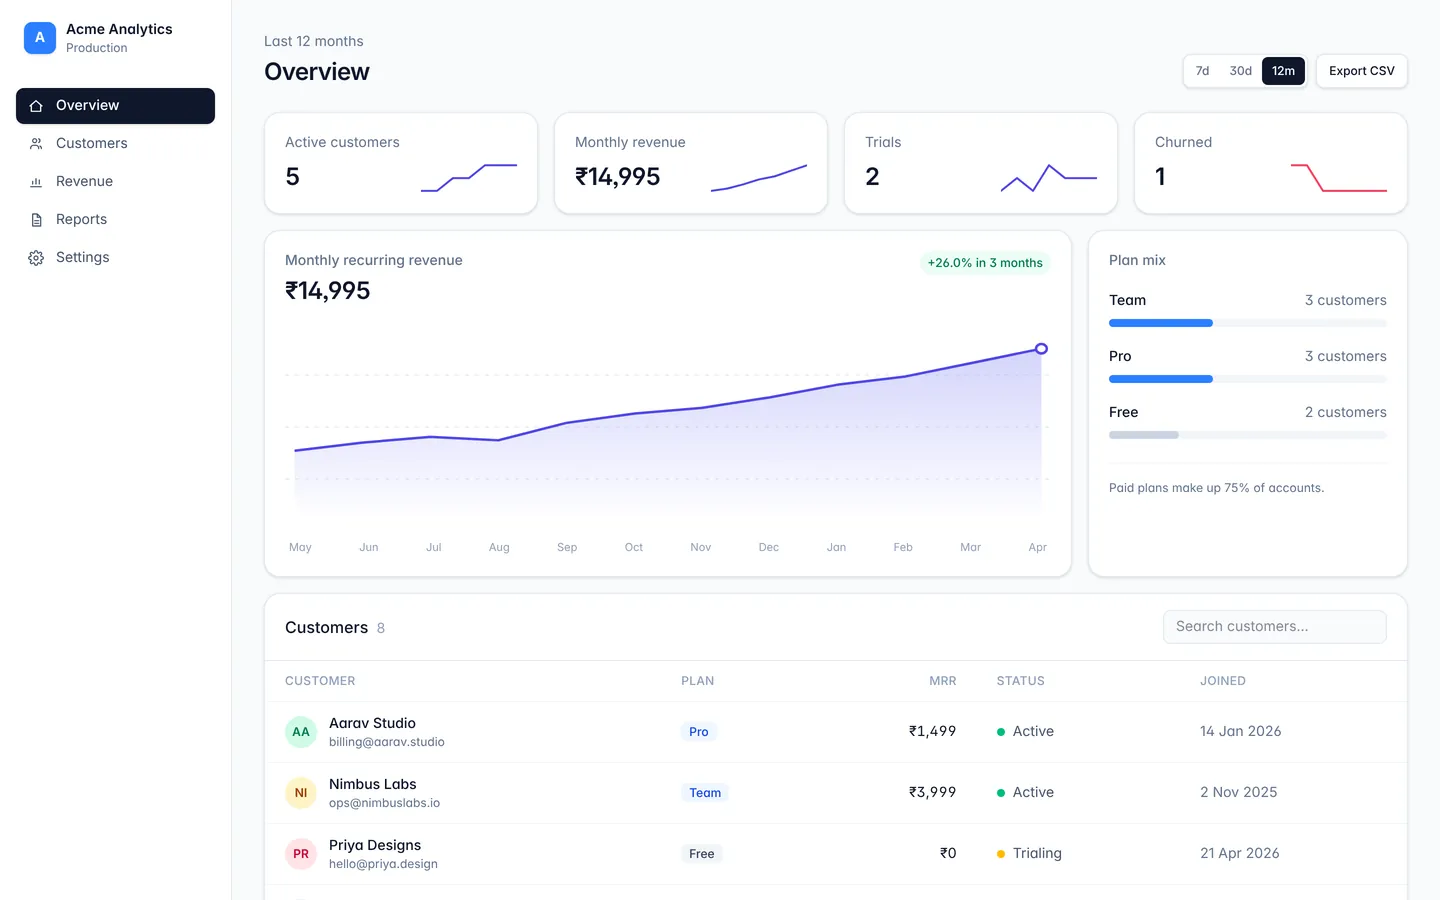
A responsive dashboard layout with sidebar navigation, stat cards, and a data table.
SaaS metrics
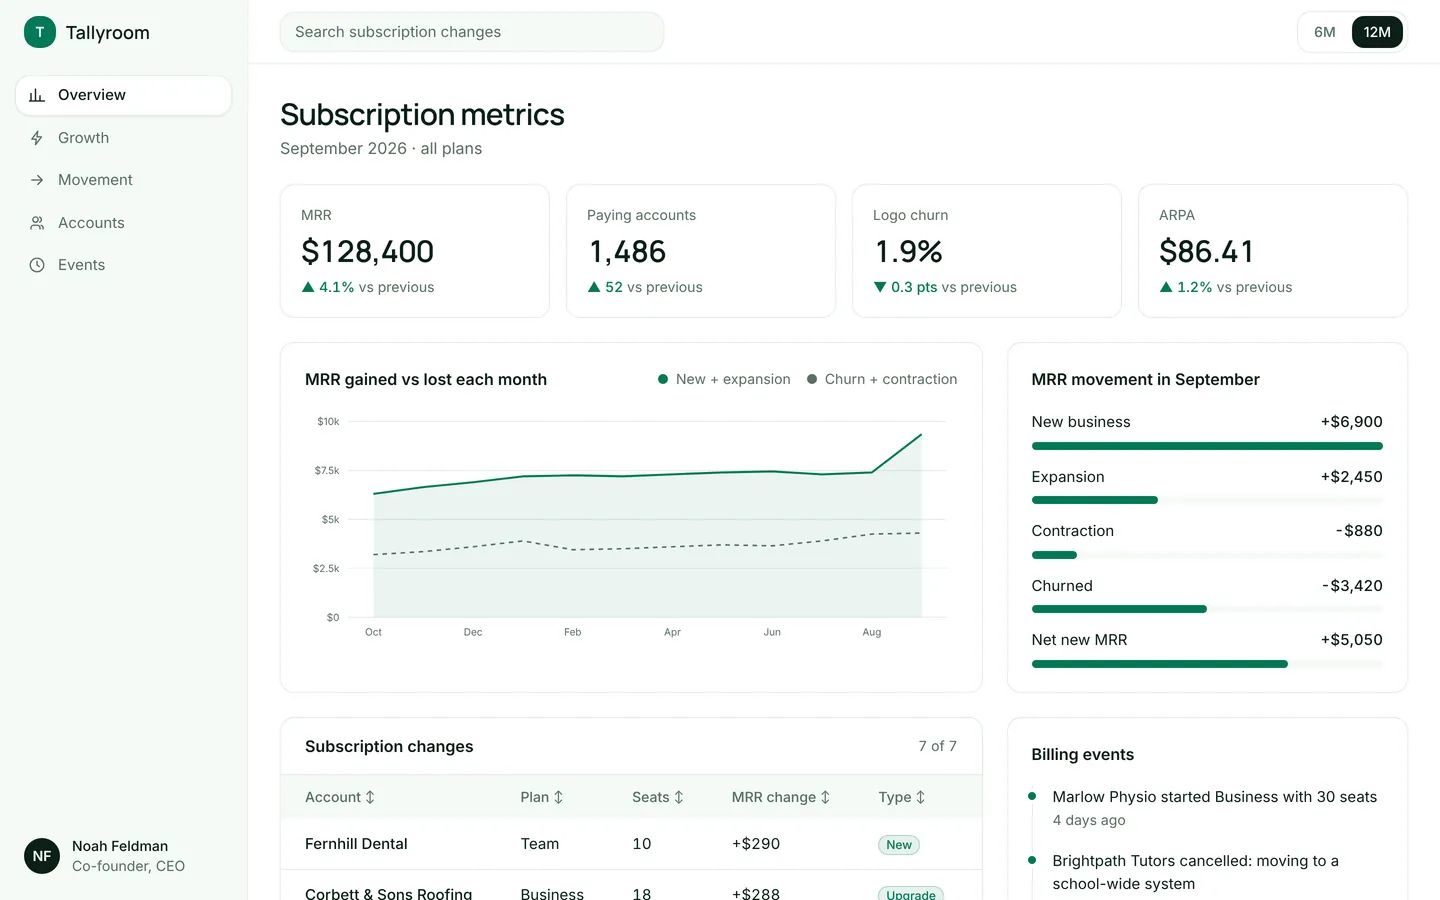
MRR, churn, ARPA and a breakdown of new, expansion and churned revenue for a subscription product.
Clinic appointments
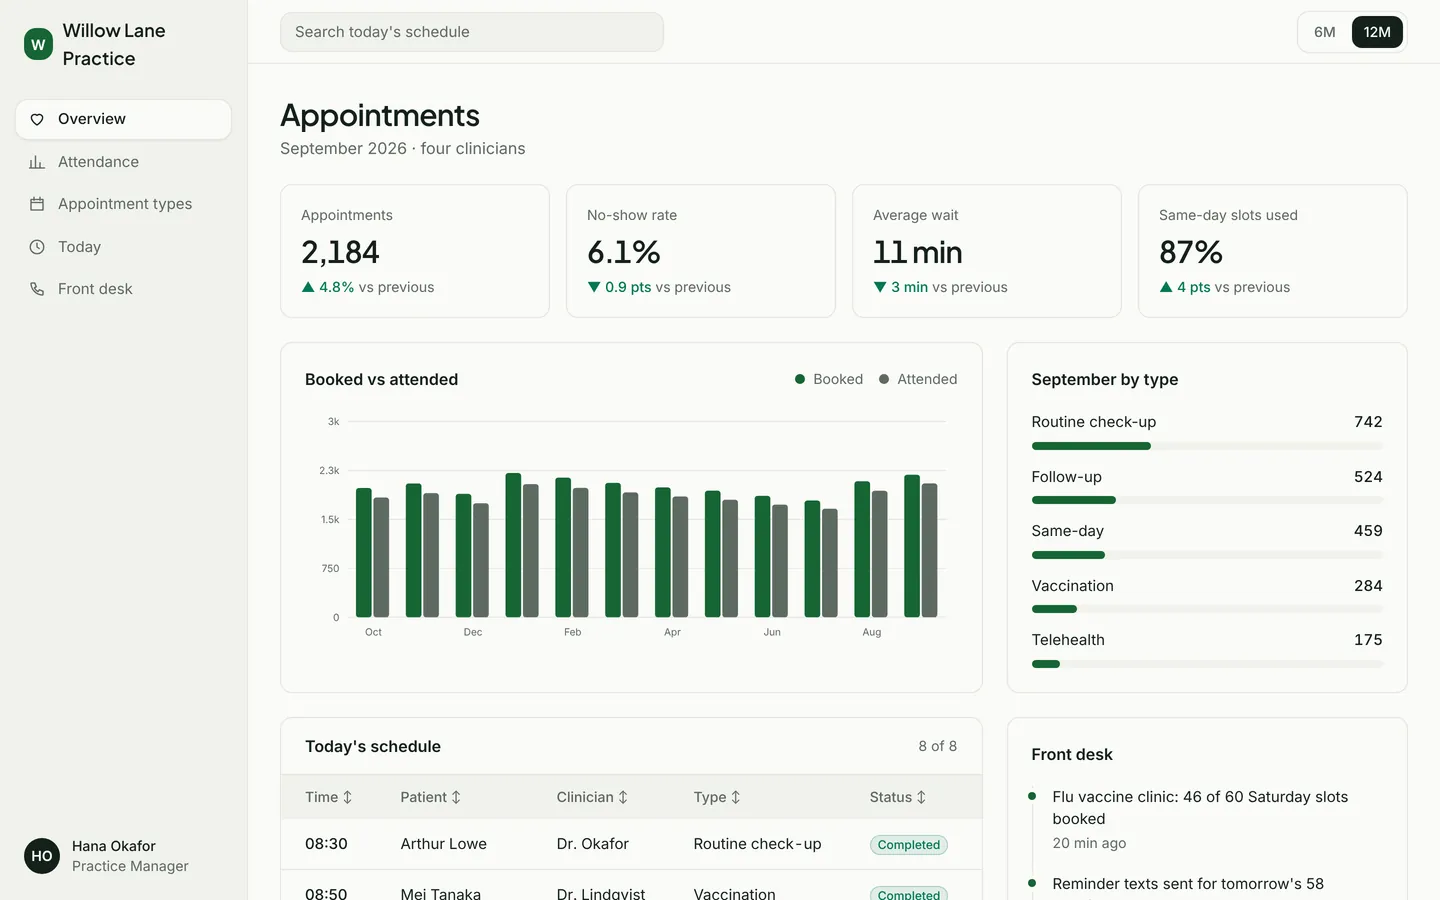
Appointments booked and attended, no-show rate, waiting times and today's schedule for a family practice.
Build on API monitoring
Create a free account, start from this template, and ask the AI agent to turn it into your app.