Dashboards · React
Clinic appointments
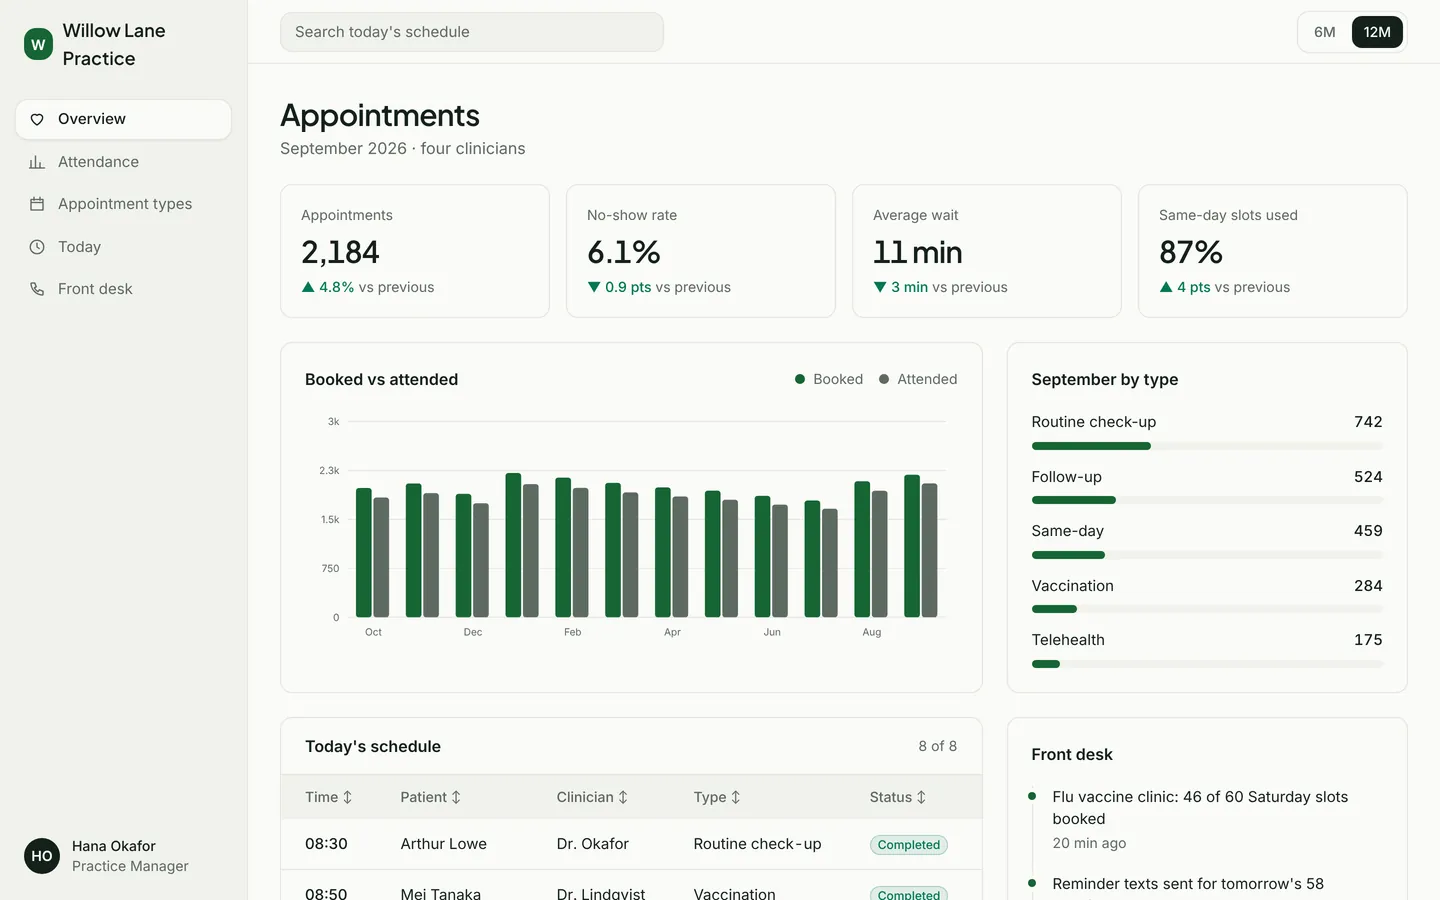
Appointments booked and attended, no-show rate, waiting times and today's schedule for a family practice.
What you get
A front-desk dashboard for a family medical practice: appointments booked against attended each month, the mix of appointment types, and today's schedule with check-in status. Clinicians, appointments and figures live in src/dashboard.ts.
Files
Exactly what is copied into a new project: 13 files, nothing generated.
Explorer 13
import type { Dashboard } from "./types"; /** Everything this dashboard shows. Edit freely. */export const dashboard: Dashboard = { "brand": "Willow Lane Practice", "user": { "name": "Hana Okafor", "role": "Practice Manager" }, "nav": [ { "label": "Overview", "icon": "heart", "href": "#overview" }, { "label": "Attendance", "icon": "chart", "href": "#trends" }, { "label": "Appointment types", "icon": "calendar", "href": "#breakdown" }, { "label": "Today", "icon": "clock", "href": "#table" }, { "label": "Front desk", "icon": "phone", "href": "#activity" } ], "title": "Appointments", "subtitle": "September 2026 · four clinicians", "ranges": [ { "label": "6M", "points": 6 }, { "label": "12M", "points": 12 } ], "kpis": [ { "label": "Appointments", "value": "2,184", "delta": "4.8%", "up": true }, { "label": "No-show rate", "value": "6.1%", "delta": "0.9 pts", "up": false, "upIsGood": false }, { "label": "Average wait", "value": "11 min", "delta": "3 min", "up": false, "upIsGood": false }, { "label": "Same-day slots used", "value": "87%", "delta": "4 pts", "up": true } ], "chart": { "title": "Booked vs attended", "type": "bar", "labels": [ "Oct", "Nov", "Dec", "Jan", "Feb", "Mar", "Apr", "May", "Jun", "Jul", "Aug", "Sep" ], "series": [ { "name": "Booked", "values": [ 1980, 2050, 1890, 2210, 2140, 2060, 1990, 1940, 1860, 1790, 2084, 2184 ] }, { "name": "Attended", "values": [ 1835, 1902, 1748, 2040, 1982, 1913, 1851, 1800, 1727, 1663, 1938, 2051 ] } ] }, "side": { "title": "September by type", "items": [ { "label": "Routine check-up", "value": "742", "pct": 34 }, { "label": "Follow-up", "value": "524", "pct": 24 }, { "label": "Same-day", "value": "459", "pct": 21 }, { "label": "Vaccination", "value": "284", "pct": 13 }, { "label": "Telehealth", "value": "175", "pct": 8 } ] }, "table": { "title": "Today's schedule", "columns": [ "Time", "Patient", "Clinician", "Type", "Status", "Room" ], "statusColumn": 4, "tones": { "Completed": "good", "With clinician": "accent", "Checked in": "warn", "Booked": "neutral", "No-show": "bad" }, "rows": [ [ "08:30", "Arthur Lowe", "Dr. Okafor", "Routine check-up", "Completed", "Room 2" ], [ "08:50", "Mei Tanaka", "Dr. Lindqvist", "Vaccination", "Completed", "Room 4" ], [ "09:10", "Daniel Reyes", "Dr. Okafor", "Follow-up", "No-show", "Room 2" ], [ "09:30", "Grace Whitlock", "Nurse Patel", "Same-day", "With clinician", "Room 3" ], [ "09:45", "Omar Haddad", "Dr. Lindqvist", "Telehealth", "Checked in", "Video" ], [ "10:00", "Elena Vasquez", "Dr. Okafor", "Routine check-up", "Booked", "Room 2" ], [ "10:20", "Robert King", "Nurse Patel", "Vaccination", "Booked", "Room 3" ], [ "10:40", "Siobhan Burke", "Dr. Amari", "Follow-up", "Booked", "Room 1" ] ] }, "feed": { "title": "Front desk", "items": [ { "text": "Flu vaccine clinic: 46 of 60 Saturday slots booked", "time": "20 min ago" }, { "text": "Reminder texts sent for tomorrow's 58 appointments", "time": "Yesterday, 17:00" }, { "text": "Dr. Amari added two extra same-day slots on Thursdays", "time": "Sep 24" } ] }};Remix
Remix this template
Describe what to change and the agent starts from Clinic appointments's files. The box is already started for you: finish “Start from Clinic appointments and …”
Dependencies
Documented from the template's package.json. The runtime has a prebuilt dependency set for Vite + React + TypeScript, so installs are fast.
- react^19.1.0
- react-dom^19.1.0
- vite^6.3.0
- @vitejs/plugin-react^4.4.0
- tailwindcss^4.1.0
- @tailwindcss/vite^4.1.0
- typescript^5.8.0
How it runs
- Framework
- Vite + React + TypeScript
- Dev command
- npm run dev
- Build command
- npm run build
- Output directory
- dist
- Port
- 5173
- Entry route
- /
Projects run in an isolated sandbox with a live preview. Read the projects documentation for settings, snapshots and deployment.
Keep browsing
All templates- Featured
Analytics dashboard
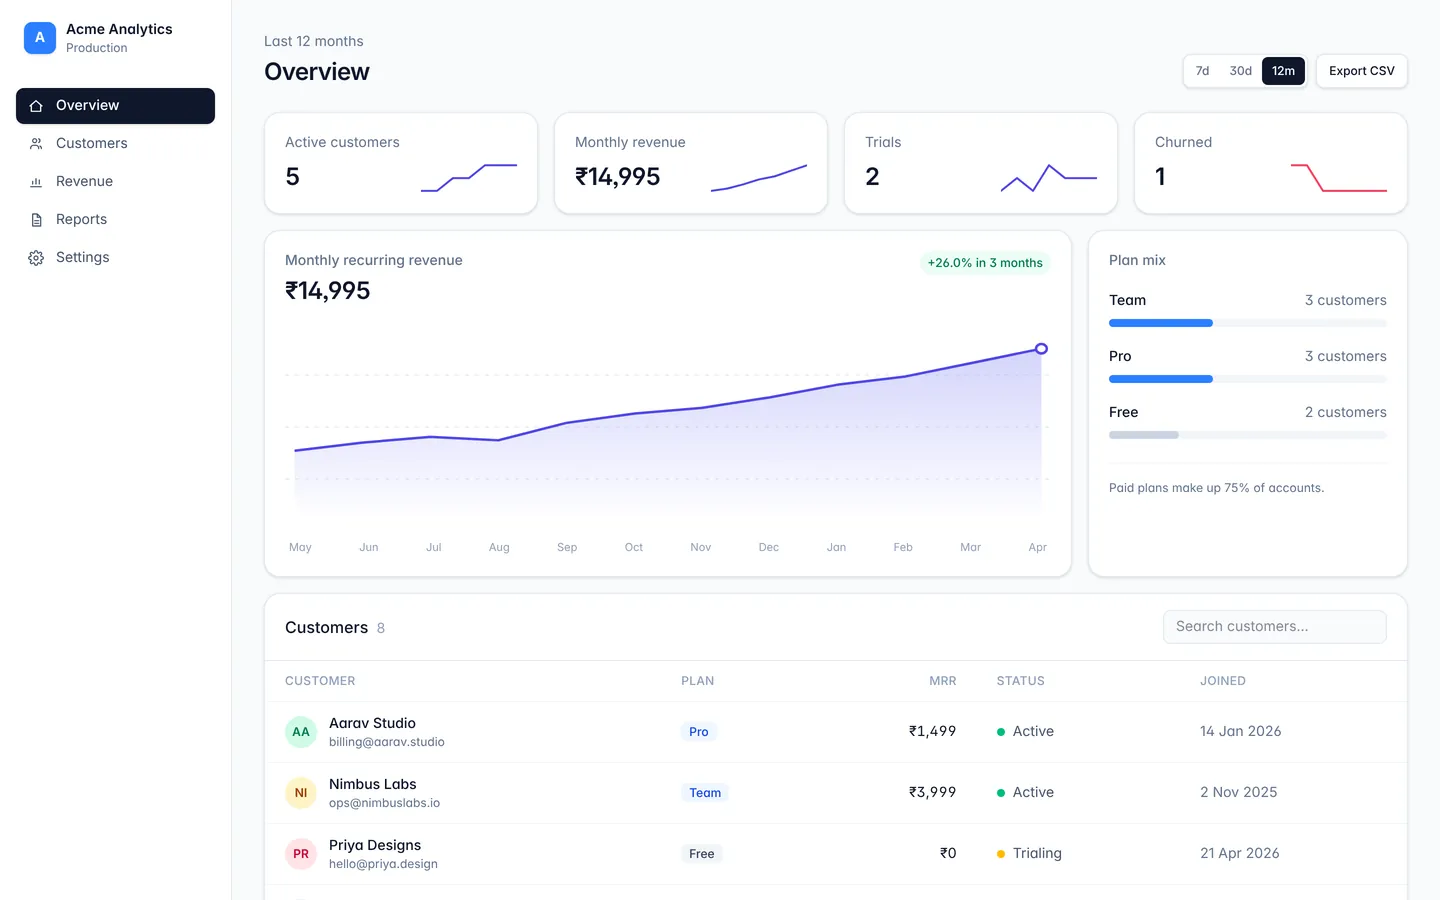
A responsive dashboard layout with sidebar navigation, stat cards, and a data table.
API monitoring
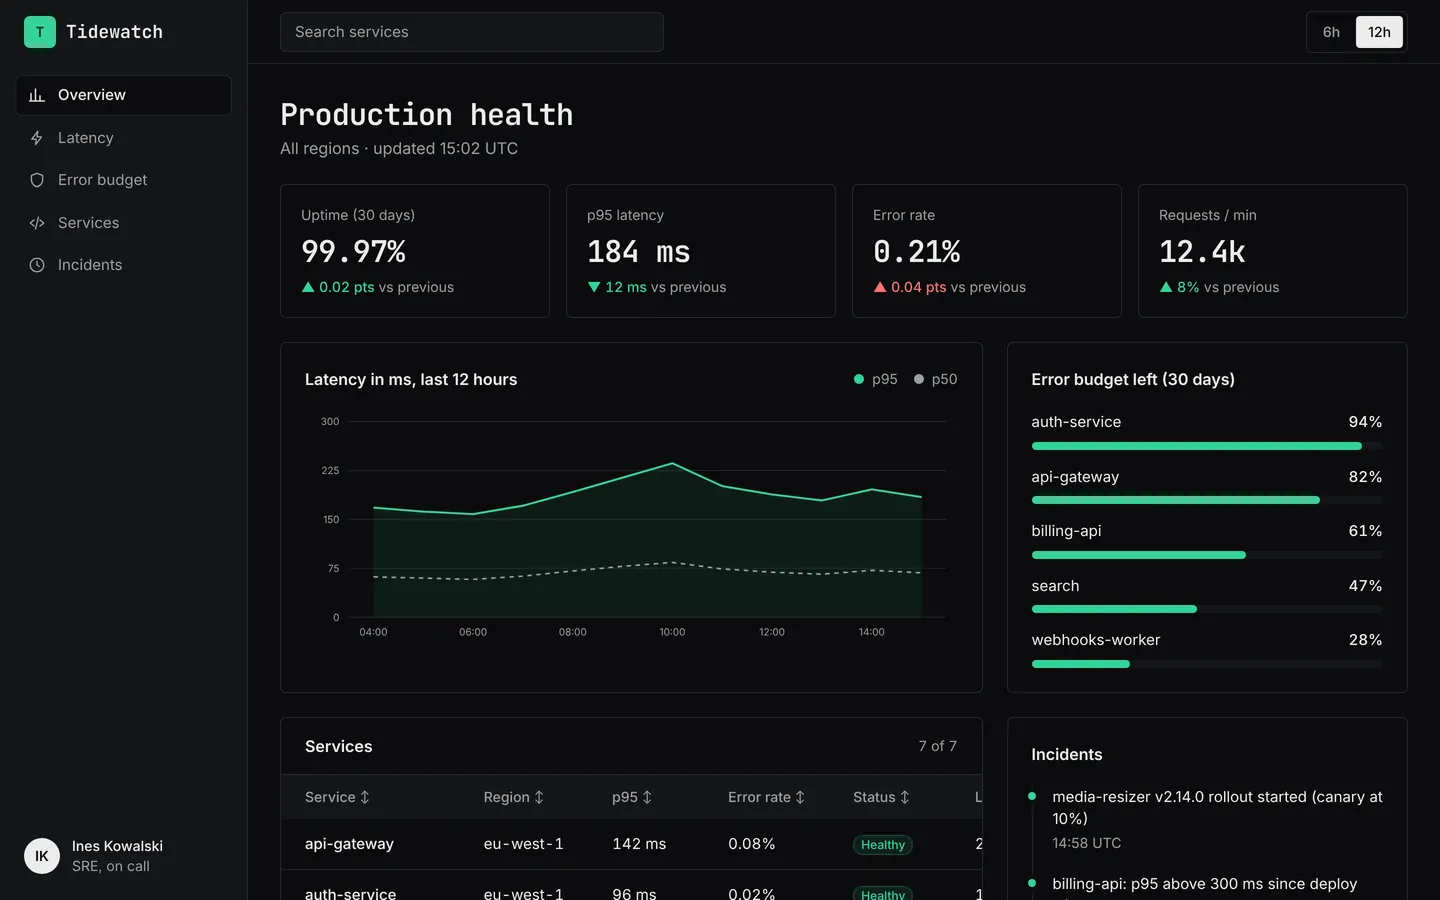
Latency, error rates, uptime and service health for an API platform, in a dark on-call layout.
SaaS metrics
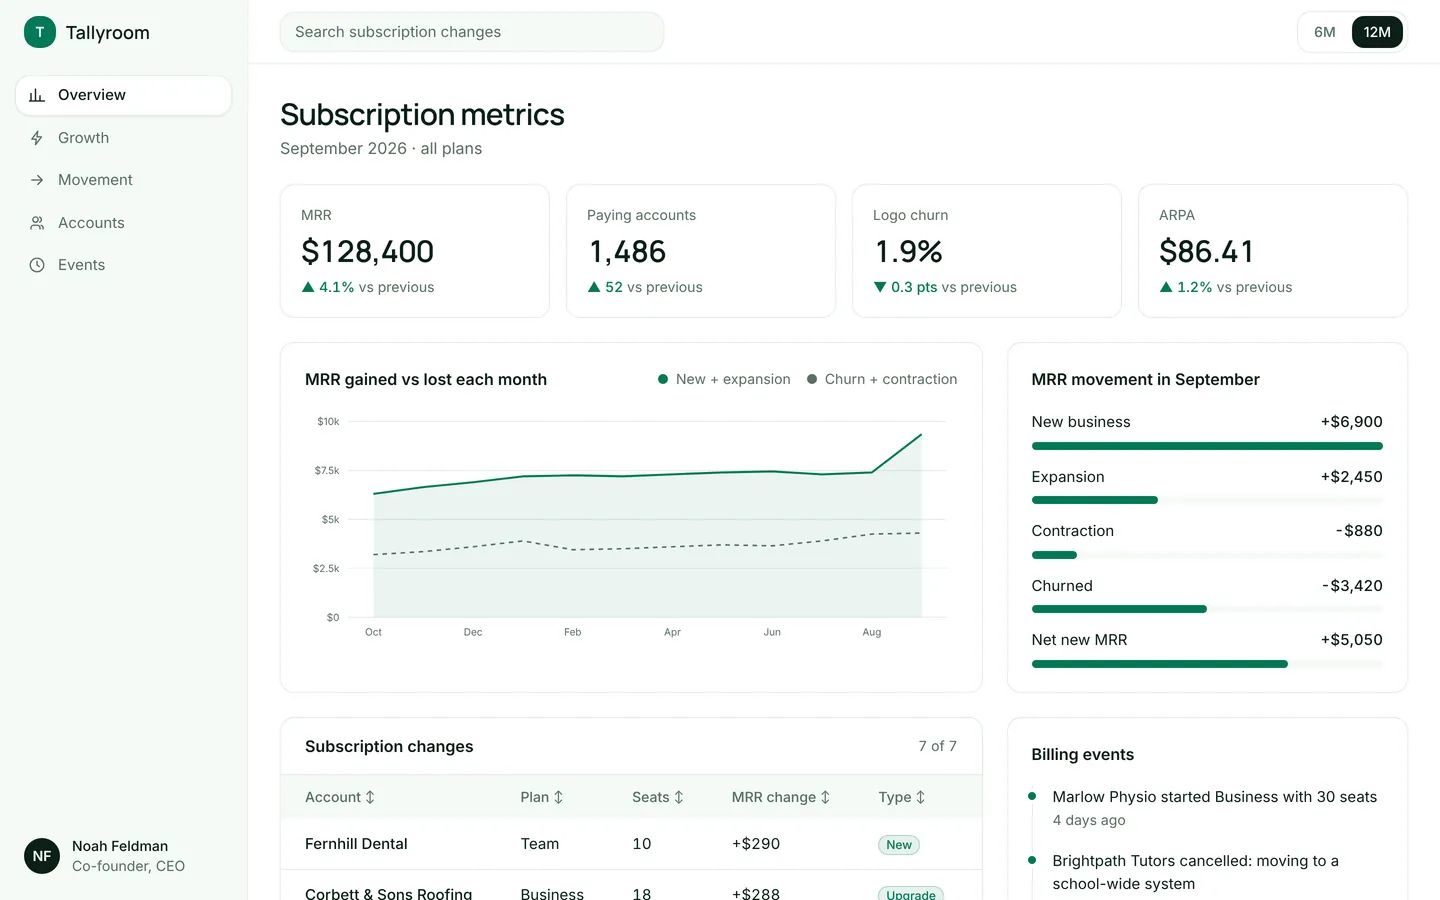
MRR, churn, ARPA and a breakdown of new, expansion and churned revenue for a subscription product.
Build on Clinic appointments
Create a free account, start from this template, and ask the AI agent to turn it into your app.