Dashboards · React
Delivery fleet
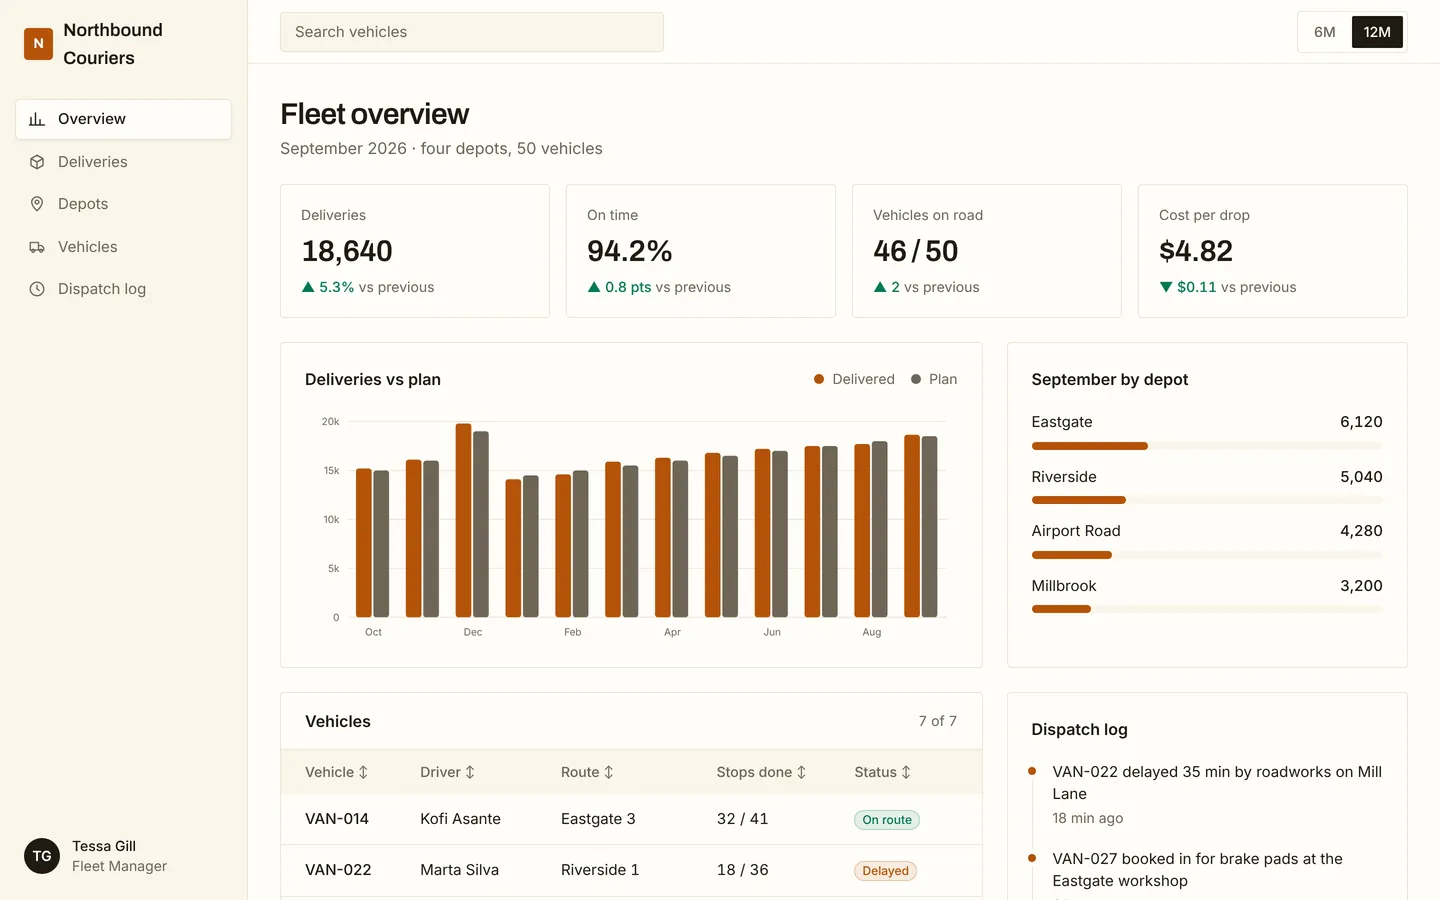
Deliveries against plan, depot volumes and live vehicle status for a regional courier fleet.
What you get
A logistics dashboard for a regional courier: deliveries per month against plan, volume by depot, and each van's route, progress and ETA. Vehicles, depots and totals live in src/dashboard.ts.
Files
Exactly what is copied into a new project: 13 files, nothing generated.
Explorer 13
import type { Dashboard } from "./types"; /** Everything this dashboard shows. Edit freely. */export const dashboard: Dashboard = { "brand": "Northbound Couriers", "user": { "name": "Tessa Gill", "role": "Fleet Manager" }, "nav": [ { "label": "Overview", "icon": "chart", "href": "#overview" }, { "label": "Deliveries", "icon": "box", "href": "#trends" }, { "label": "Depots", "icon": "pin", "href": "#breakdown" }, { "label": "Vehicles", "icon": "truck", "href": "#table" }, { "label": "Dispatch log", "icon": "clock", "href": "#activity" } ], "title": "Fleet overview", "subtitle": "September 2026 · four depots, 50 vehicles", "ranges": [ { "label": "6M", "points": 6 }, { "label": "12M", "points": 12 } ], "kpis": [ { "label": "Deliveries", "value": "18,640", "delta": "5.3%", "up": true }, { "label": "On time", "value": "94.2%", "delta": "0.8 pts", "up": true }, { "label": "Vehicles on road", "value": "46 / 50", "delta": "2", "up": true }, { "label": "Cost per drop", "value": "$4.82", "delta": "$0.11", "up": false, "upIsGood": false } ], "chart": { "title": "Deliveries vs plan", "type": "bar", "labels": [ "Oct", "Nov", "Dec", "Jan", "Feb", "Mar", "Apr", "May", "Jun", "Jul", "Aug", "Sep" ], "series": [ { "name": "Delivered", "values": [ 15200, 16100, 19800, 14100, 14600, 15900, 16300, 16800, 17200, 17500, 17700, 18640 ] }, { "name": "Plan", "values": [ 15000, 16000, 19000, 14500, 15000, 15500, 16000, 16500, 17000, 17500, 18000, 18500 ] } ] }, "side": { "title": "September by depot", "items": [ { "label": "Eastgate", "value": "6,120", "pct": 33 }, { "label": "Riverside", "value": "5,040", "pct": 27 }, { "label": "Airport Road", "value": "4,280", "pct": 23 }, { "label": "Millbrook", "value": "3,200", "pct": 17 } ] }, "table": { "title": "Vehicles", "columns": [ "Vehicle", "Driver", "Route", "Stops done", "Status", "ETA back" ], "statusColumn": 4, "tones": { "On route": "good", "Loading": "accent", "Delayed": "warn", "Returned": "neutral", "Maintenance": "bad" }, "rows": [ [ "VAN-014", "Kofi Asante", "Eastgate 3", "32 / 41", "On route", "16:40" ], [ "VAN-022", "Marta Silva", "Riverside 1", "18 / 36", "Delayed", "18:15" ], [ "TRK-005", "Sean O'Brien", "Airport linehaul", "4 / 6", "On route", "15:20" ], [ "VAN-031", "Leah Park", "Millbrook 2", "0 / 38", "Loading", "19:05" ], [ "VAN-009", "Dev Kapoor", "Eastgate 5", "44 / 44", "Returned", "14:10" ], [ "VAN-018", "Rosa Lind", "Riverside 4", "27 / 40", "On route", "17:30" ], [ "VAN-027", "Unassigned", "None", "0 / 0", "Maintenance", "Tomorrow" ] ] }, "feed": { "title": "Dispatch log", "items": [ { "text": "VAN-022 delayed 35 min by roadworks on Mill Lane", "time": "18 min ago" }, { "text": "VAN-027 booked in for brake pads at the Eastgate workshop", "time": "2 hours ago" }, { "text": "Millbrook evening wave released: 4 routes, 152 stops", "time": "Today, 12:30" } ] }};Remix
Remix this template
Describe what to change and the agent starts from Delivery fleet's files. The box is already started for you: finish “Start from Delivery fleet and …”
Dependencies
Documented from the template's package.json. The runtime has a prebuilt dependency set for Vite + React + TypeScript, so installs are fast.
- react^19.1.0
- react-dom^19.1.0
- vite^6.3.0
- @vitejs/plugin-react^4.4.0
- tailwindcss^4.1.0
- @tailwindcss/vite^4.1.0
- typescript^5.8.0
How it runs
- Framework
- Vite + React + TypeScript
- Dev command
- npm run dev
- Build command
- npm run build
- Output directory
- dist
- Port
- 5173
- Entry route
- /
Projects run in an isolated sandbox with a live preview. Read the projects documentation for settings, snapshots and deployment.
Keep browsing
All templates- Featured
Analytics dashboard
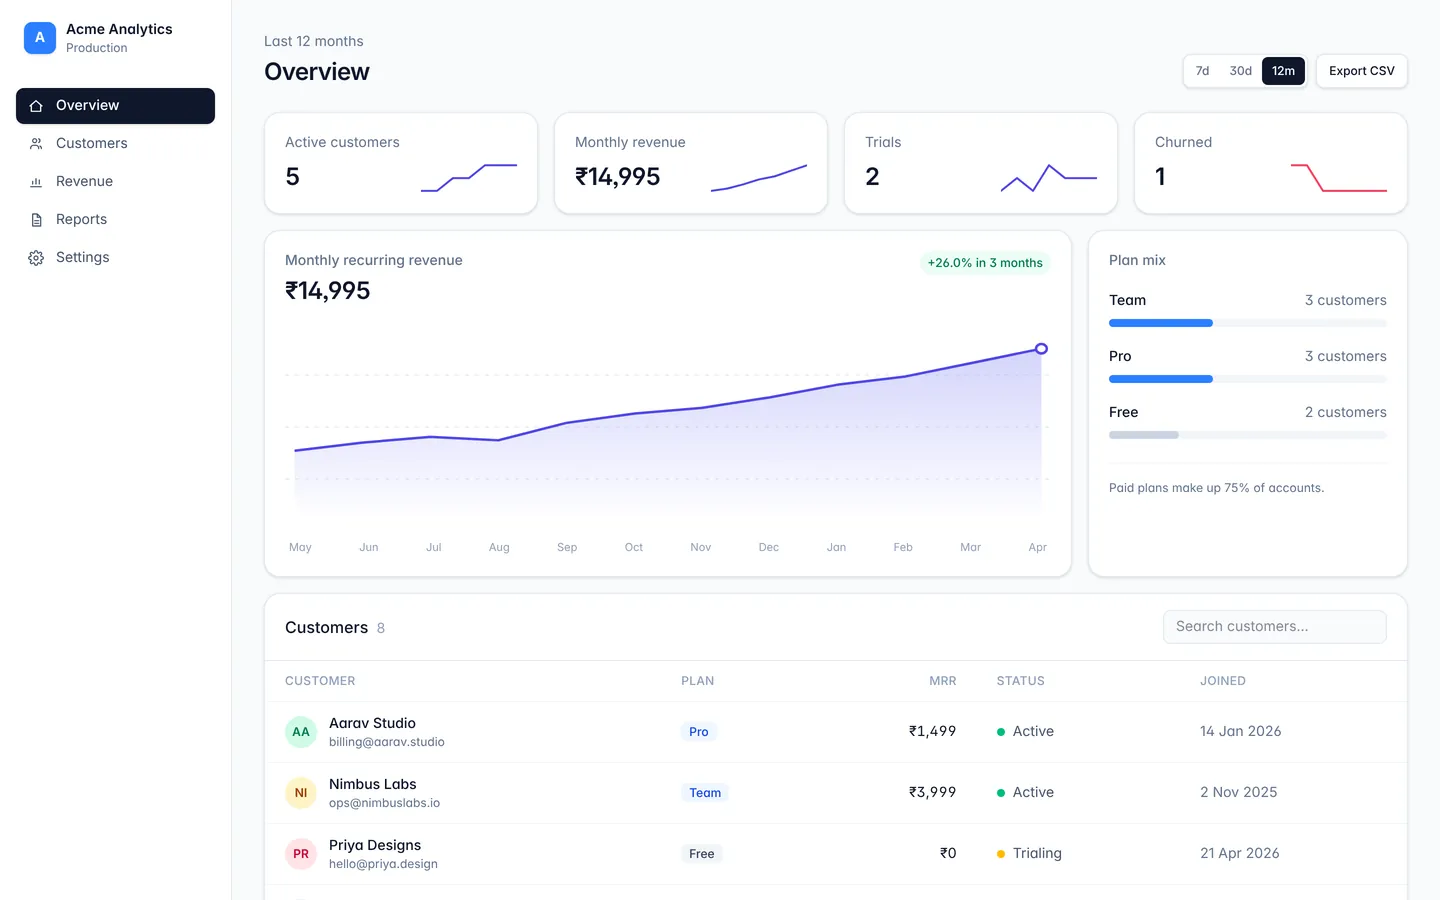
A responsive dashboard layout with sidebar navigation, stat cards, and a data table.
API monitoring
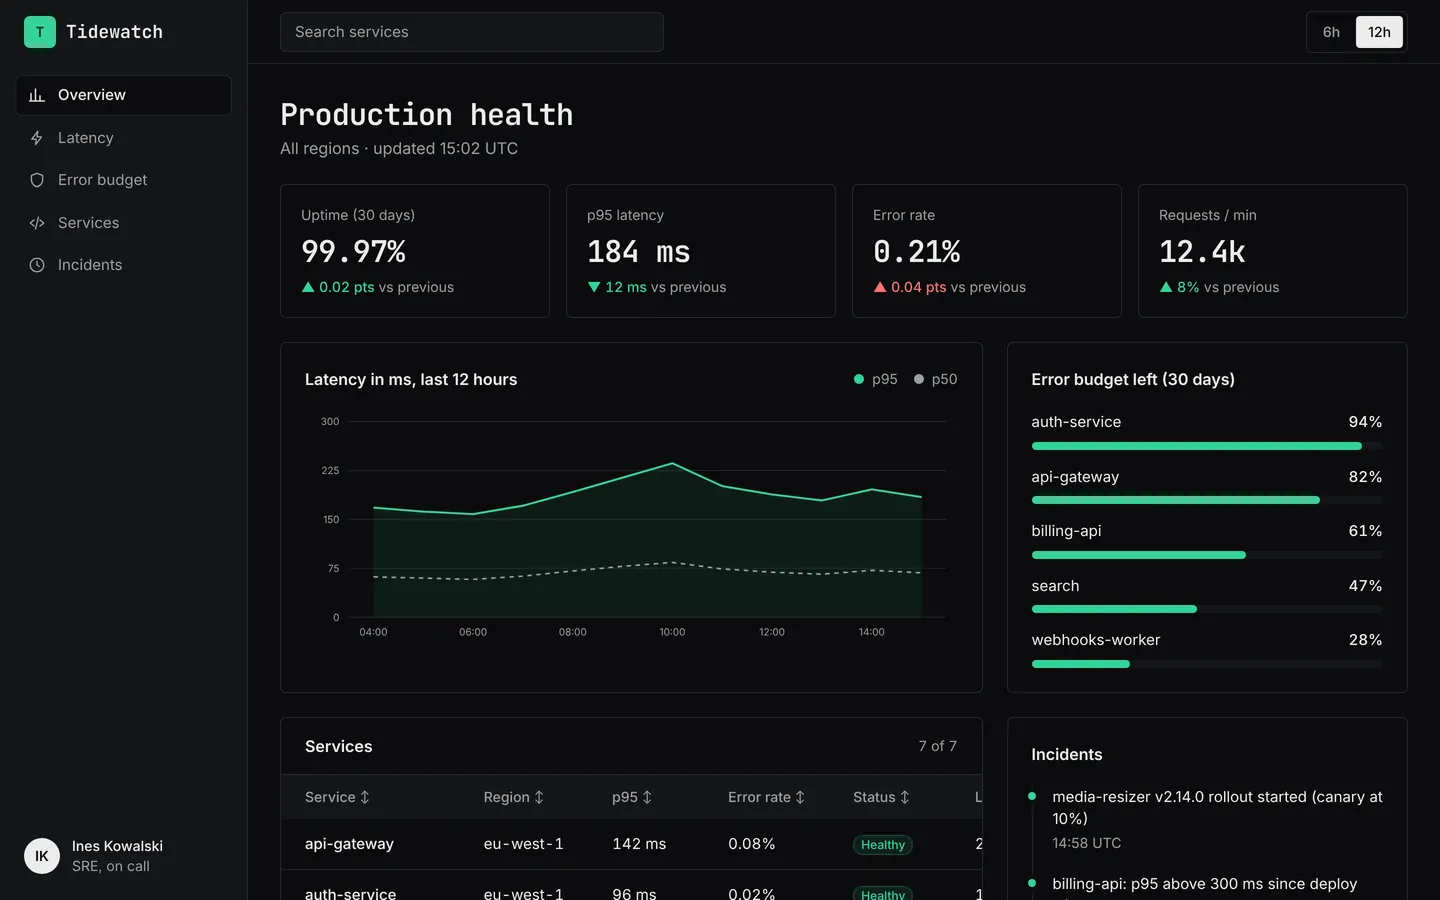
Latency, error rates, uptime and service health for an API platform, in a dark on-call layout.
SaaS metrics
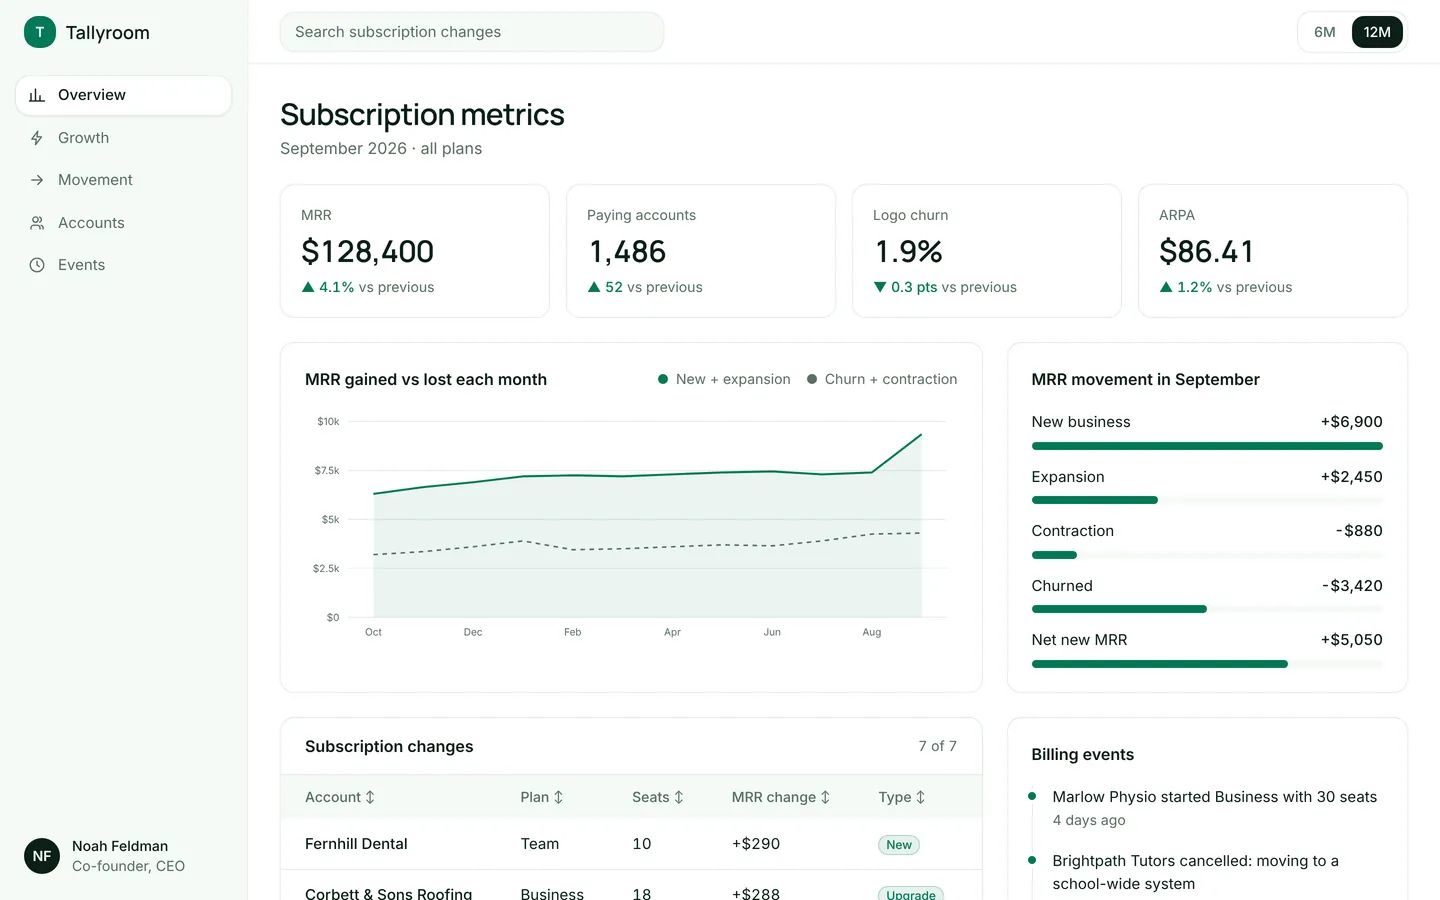
MRR, churn, ARPA and a breakdown of new, expansion and churned revenue for a subscription product.
Build on Delivery fleet
Create a free account, start from this template, and ask the AI agent to turn it into your app.