Dashboards · React
Sales dashboard
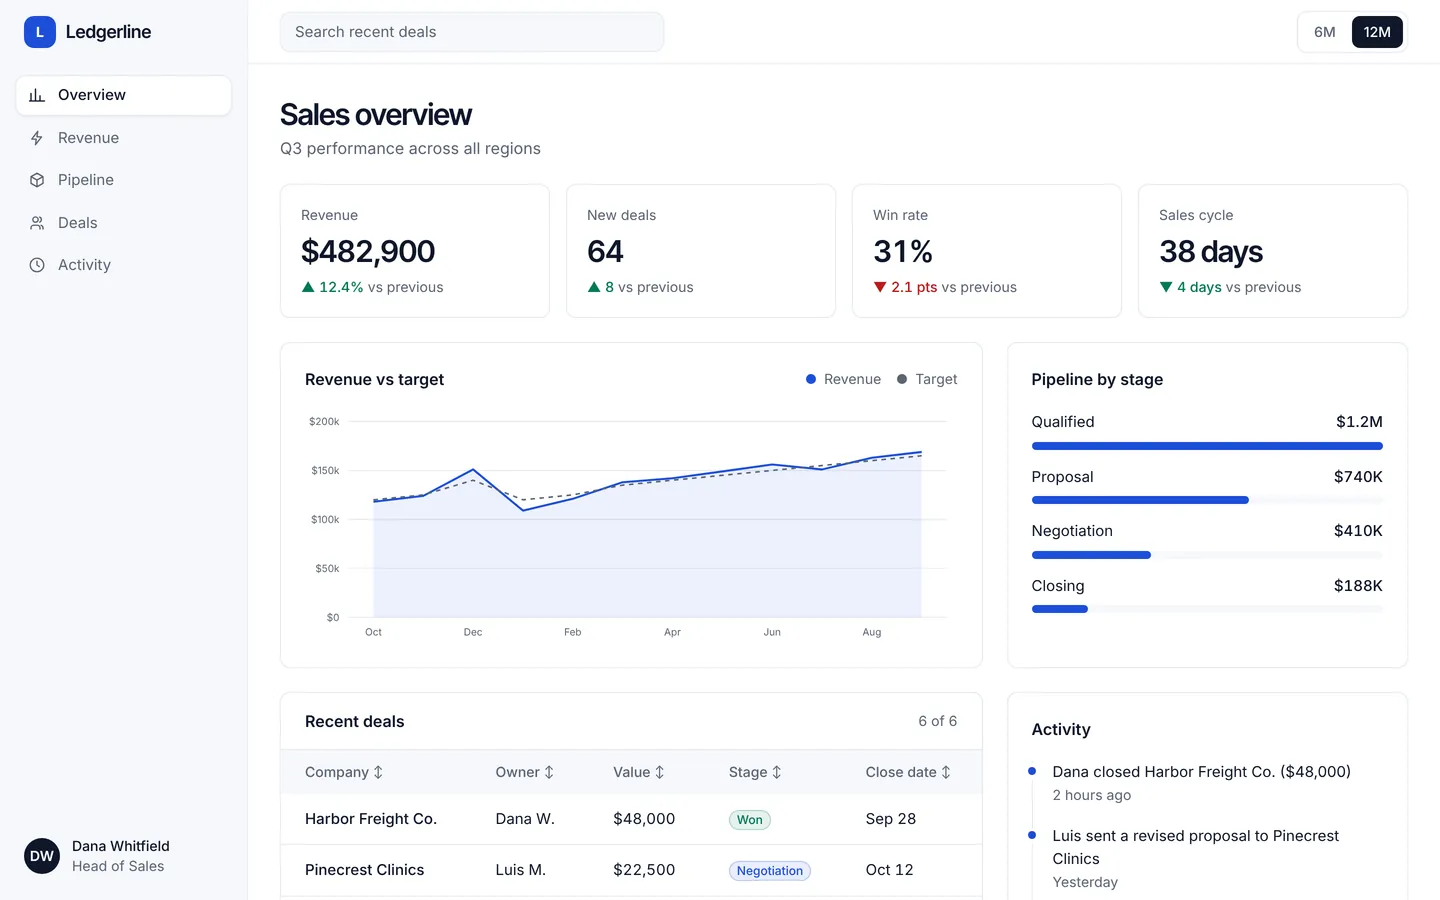
Revenue, pipeline and deals at a glance, with a searchable, sortable deals table.
What you get
A sales overview for a small team: four headline numbers, revenue against target by month, pipeline by stage, recent deals with status, and an activity feed. Sample data lives in src/dashboard.ts.
Files
Exactly what is copied into a new project: 13 files, nothing generated.
Explorer 13
<!doctype html><html lang="en"> <head> <meta charset="UTF-8" /> <meta name="viewport" content="width=device-width, initial-scale=1.0" /> <title>Sales overview · Ledgerline</title> <meta name="description" content="Revenue, pipeline and deals at a glance, with a searchable, sortable deals table." /> <meta name="theme-color" content="#ffffff" /> <link rel="preconnect" href="https://fonts.googleapis.com" /> <link rel="preconnect" href="https://fonts.gstatic.com" crossorigin /> <link rel="stylesheet" href="https://fonts.googleapis.com/css2?family=Inter+Tight:wght@400;500;600;700&family=Inter:wght@400;500;600;700&display=swap" /> </head> <body> <div id="root"></div> <script type="module" src="/src/main.tsx"></script> </body></html>Remix
Remix this template
Describe what to change and the agent starts from Sales dashboard's files. The box is already started for you: finish “Start from Sales dashboard and …”
Dependencies
Documented from the template's package.json. The runtime has a prebuilt dependency set for Vite + React + TypeScript, so installs are fast.
- react^19.1.0
- react-dom^19.1.0
- vite^6.3.0
- @vitejs/plugin-react^4.4.0
- tailwindcss^4.1.0
- @tailwindcss/vite^4.1.0
- typescript^5.8.0
How it runs
- Framework
- Vite + React + TypeScript
- Dev command
- npm run dev
- Build command
- npm run build
- Output directory
- dist
- Port
- 5173
- Entry route
- /
Projects run in an isolated sandbox with a live preview. Read the projects documentation for settings, snapshots and deployment.
Keep browsing
All templates- Featured
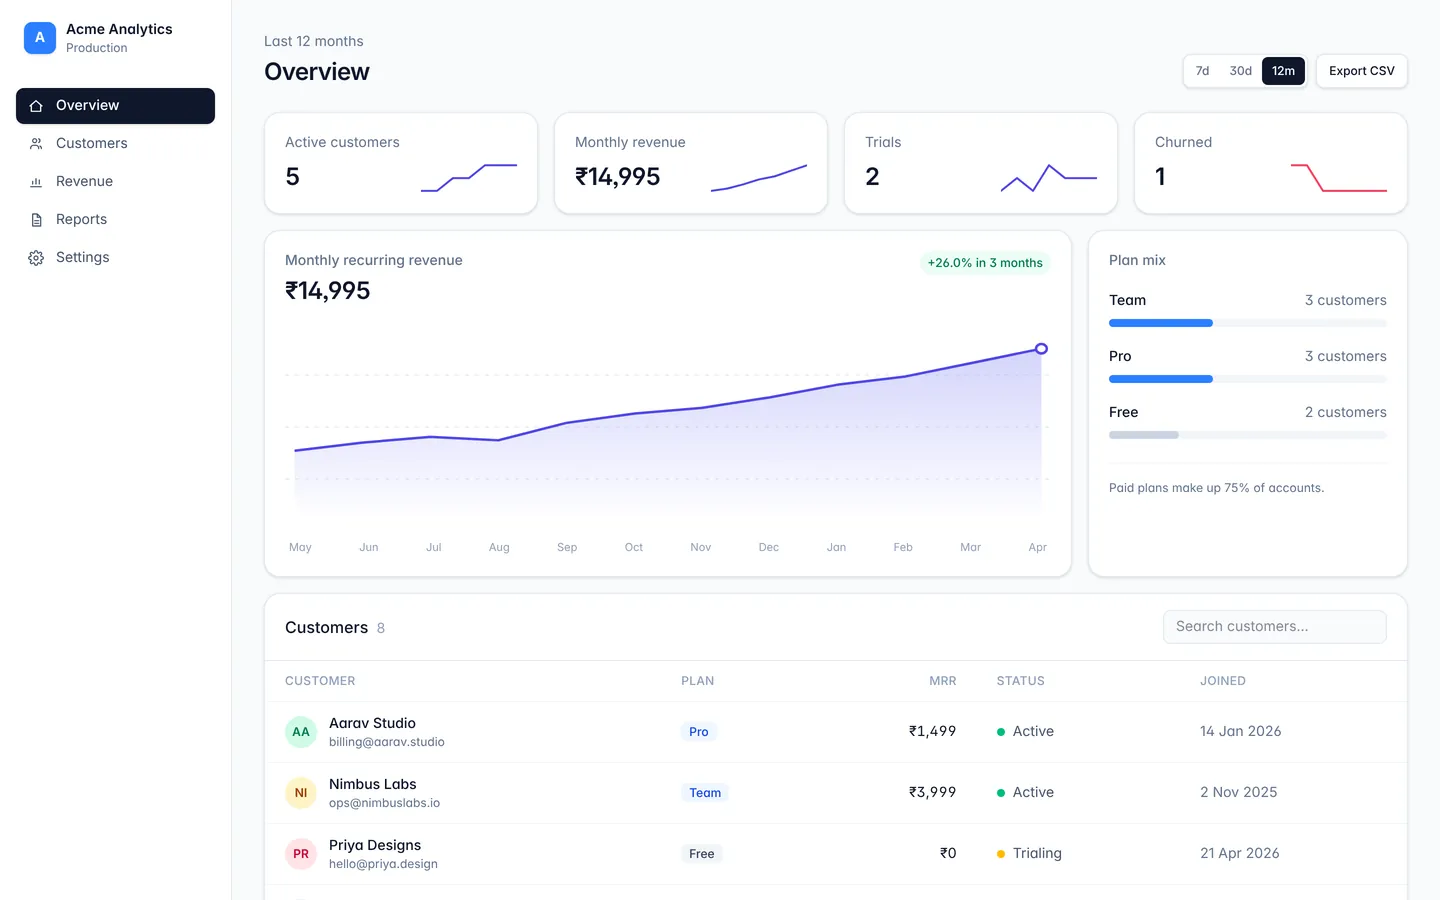
Analytics dashboard
A responsive dashboard layout with sidebar navigation, stat cards, and a data table.
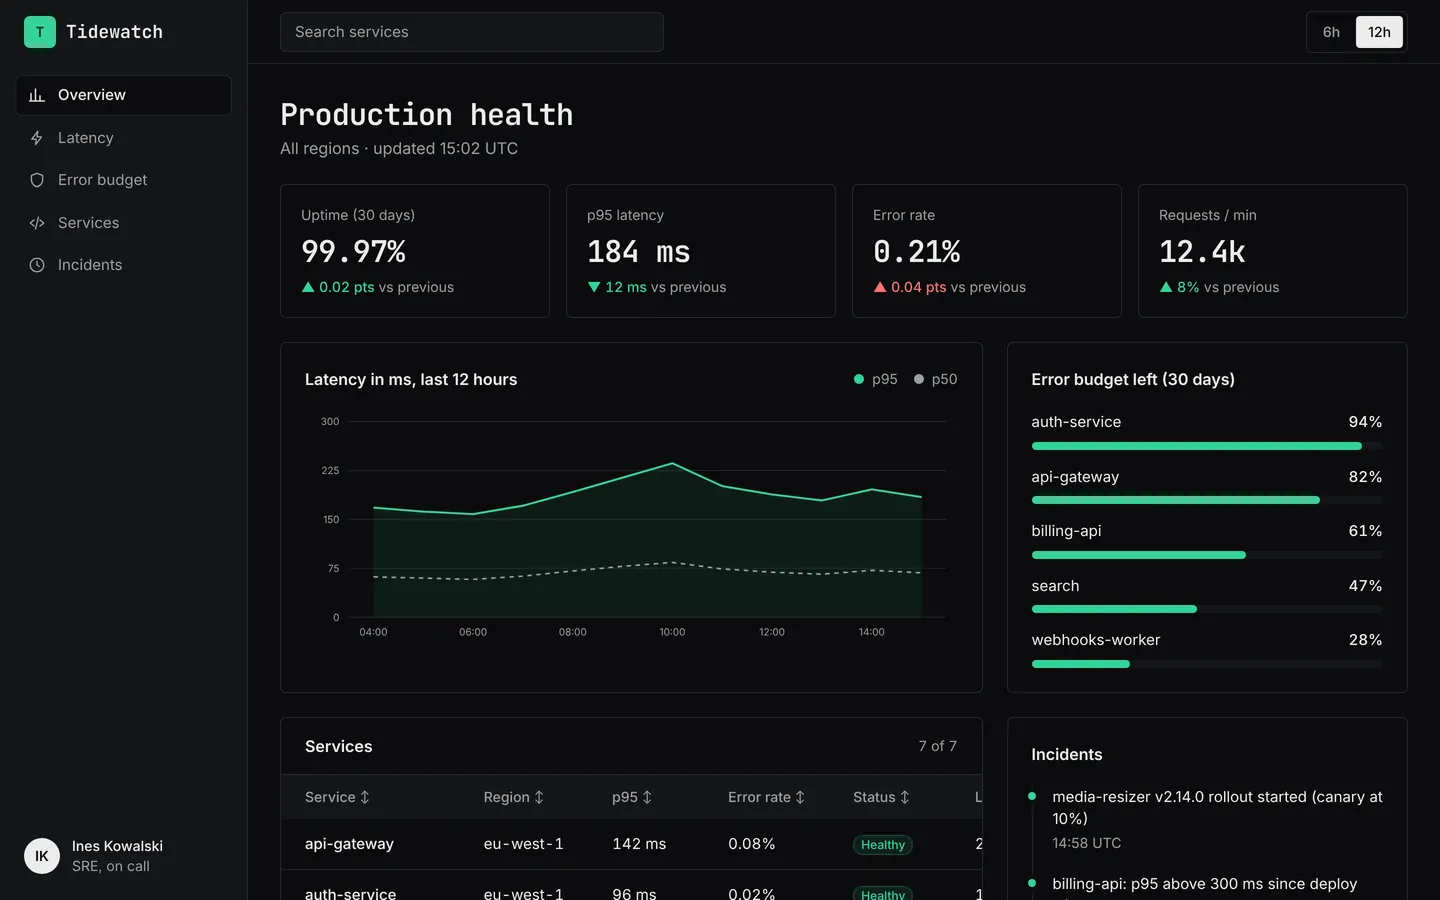
API monitoring
Latency, error rates, uptime and service health for an API platform, in a dark on-call layout.
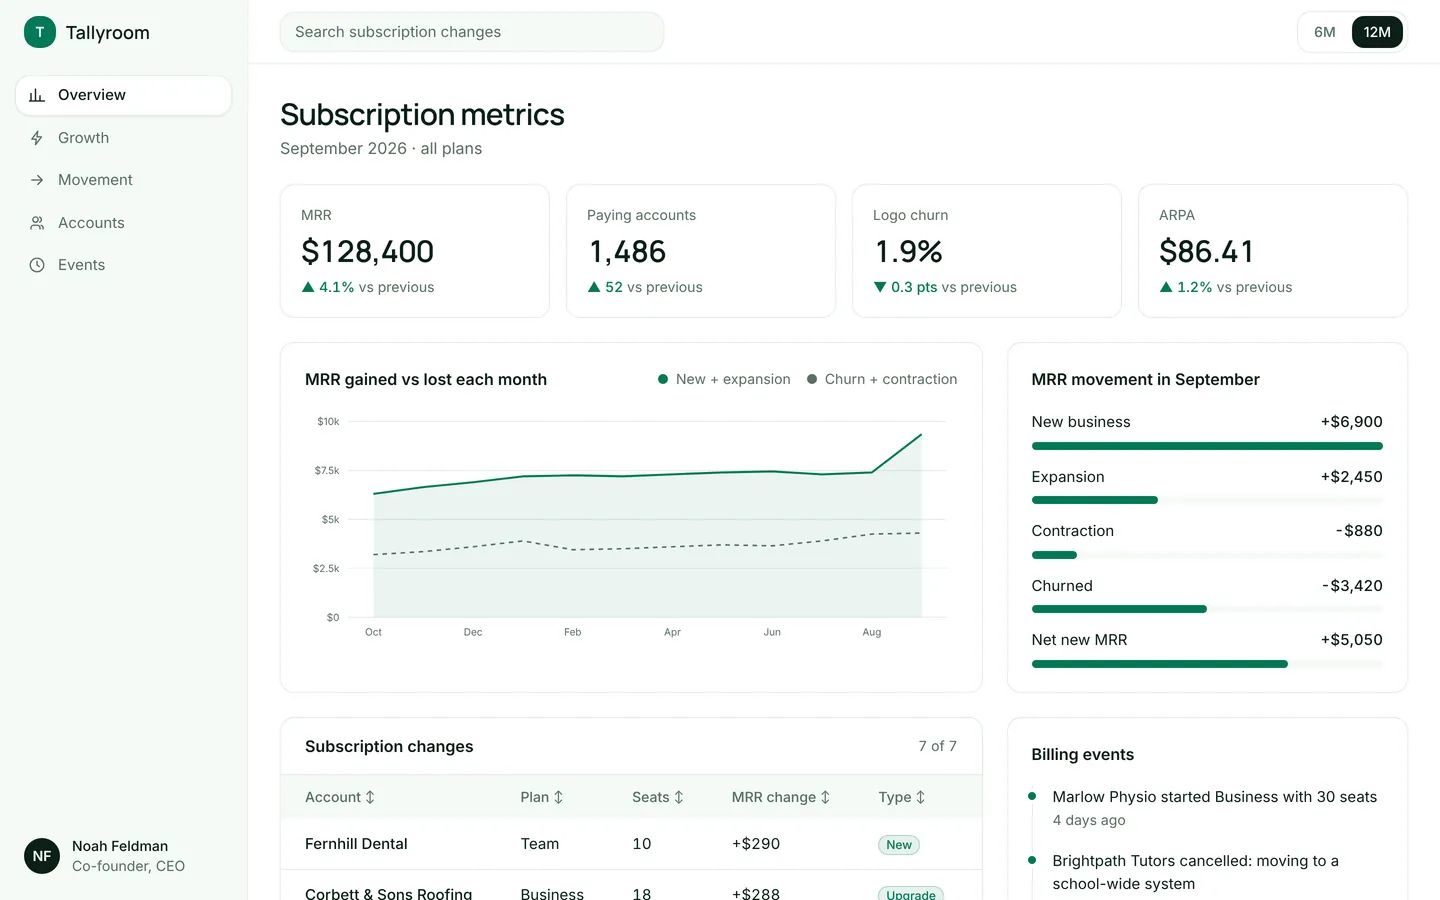
SaaS metrics
MRR, churn, ARPA and a breakdown of new, expansion and churned revenue for a subscription product.
Build on Sales dashboard
Create a free account, start from this template, and ask the AI agent to turn it into your app.