Dashboards · React
Website analytics
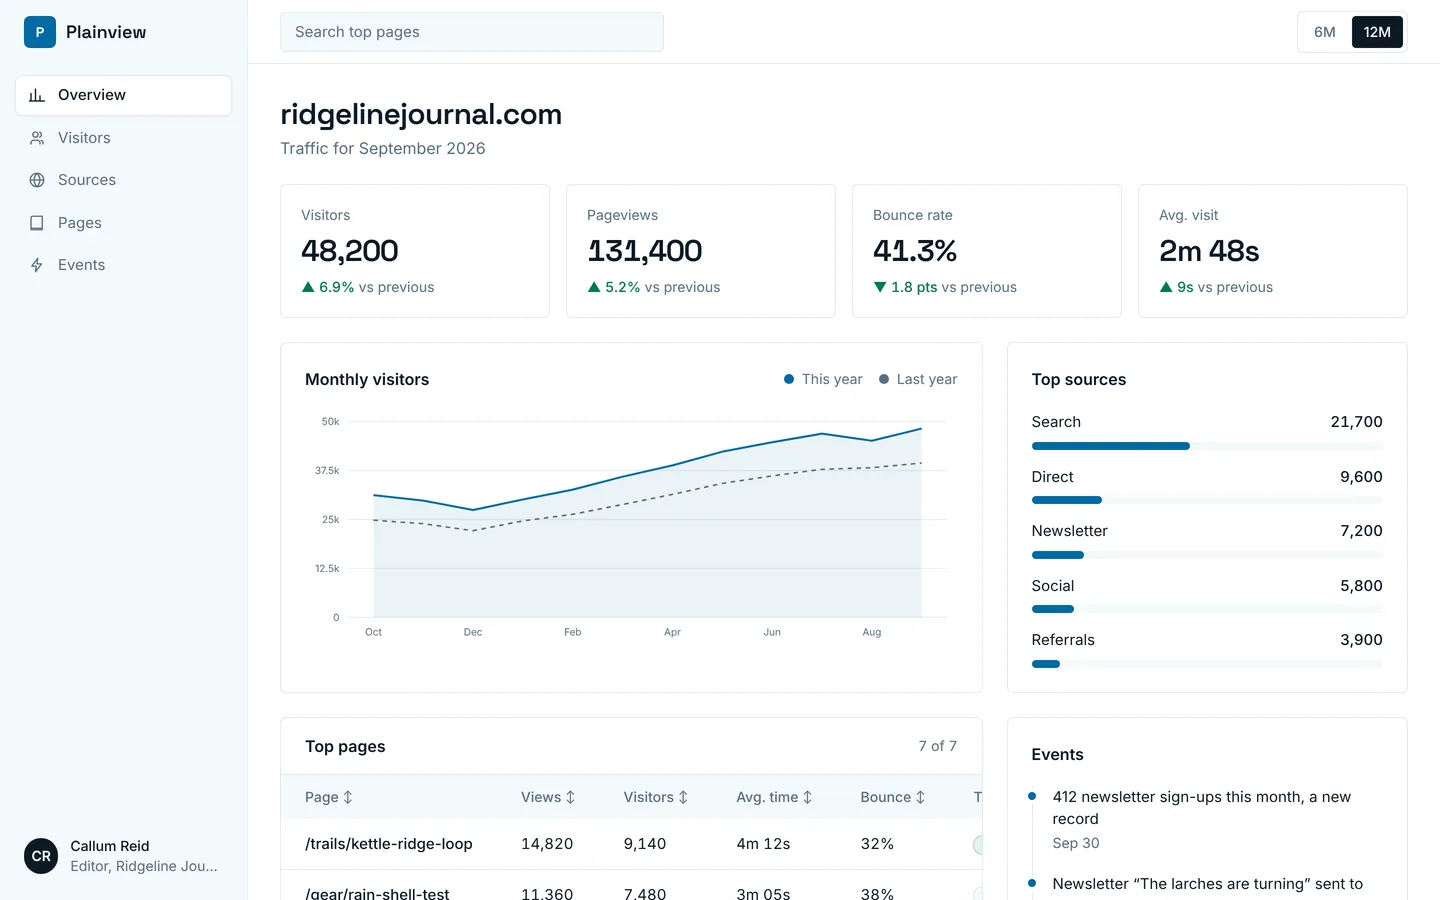
Visitors, traffic sources and top pages for a content site, with year-over-year comparison.
What you get
A privacy-friendly analytics view for an independent hiking magazine: monthly visitors against last year, where traffic comes from, and the pages people read most. Pages, sources and totals live in src/dashboard.ts.
Files
Exactly what is copied into a new project: 13 files, nothing generated.
Explorer 13
import type { Dashboard } from "./types"; /** Everything this dashboard shows. Edit freely. */export const dashboard: Dashboard = { "brand": "Plainview", "user": { "name": "Callum Reid", "role": "Editor, Ridgeline Journal" }, "nav": [ { "label": "Overview", "icon": "chart", "href": "#overview" }, { "label": "Visitors", "icon": "users", "href": "#trends" }, { "label": "Sources", "icon": "globe", "href": "#breakdown" }, { "label": "Pages", "icon": "book", "href": "#table" }, { "label": "Events", "icon": "bolt", "href": "#activity" } ], "title": "ridgelinejournal.com", "subtitle": "Traffic for September 2026", "ranges": [ { "label": "6M", "points": 6 }, { "label": "12M", "points": 12 } ], "kpis": [ { "label": "Visitors", "value": "48,200", "delta": "6.9%", "up": true }, { "label": "Pageviews", "value": "131,400", "delta": "5.2%", "up": true }, { "label": "Bounce rate", "value": "41.3%", "delta": "1.8 pts", "up": false, "upIsGood": false }, { "label": "Avg. visit", "value": "2m 48s", "delta": "9s", "up": true } ], "chart": { "title": "Monthly visitors", "type": "line", "labels": [ "Oct", "Nov", "Dec", "Jan", "Feb", "Mar", "Apr", "May", "Jun", "Jul", "Aug", "Sep" ], "series": [ { "name": "This year", "values": [ 31200, 29800, 27400, 30100, 32600, 35900, 38800, 42300, 44700, 46900, 45100, 48200 ] }, { "name": "Last year", "values": [ 24800, 23900, 22100, 24600, 26300, 28800, 31400, 34200, 36100, 37800, 38200, 39400 ] } ] }, "side": { "title": "Top sources", "items": [ { "label": "Search", "value": "21,700", "pct": 45 }, { "label": "Direct", "value": "9,600", "pct": 20 }, { "label": "Newsletter", "value": "7,200", "pct": 15 }, { "label": "Social", "value": "5,800", "pct": 12 }, { "label": "Referrals", "value": "3,900", "pct": 8 } ] }, "table": { "title": "Top pages", "columns": [ "Page", "Views", "Visitors", "Avg. time", "Bounce", "Trend" ], "statusColumn": 5, "tones": { "Rising": "good", "Steady": "neutral", "Falling": "warn" }, "rows": [ [ "/trails/kettle-ridge-loop", "14,820", "9,140", "4m 12s", "32%", "Rising" ], [ "/gear/rain-shell-test", "11,360", "7,480", "3m 05s", "38%", "Steady" ], [ "/guides/first-overnight", "9,870", "6,210", "5m 40s", "27%", "Rising" ], [ "/trails/cedar-falls", "7,420", "5,030", "2m 51s", "44%", "Falling" ], [ "/gear/budget-stoves", "6,310", "4,560", "3m 22s", "40%", "Steady" ], [ "/", "5,980", "5,120", "0m 58s", "52%", "Steady" ], [ "/newsletter", "3,240", "2,970", "1m 10s", "61%", "Falling" ] ] }, "feed": { "title": "Events", "items": [ { "text": "412 newsletter sign-ups this month, a new record", "time": "Sep 30" }, { "text": "Newsletter “The larches are turning” sent to 12,400 readers", "time": "Sep 26" }, { "text": "Traffic spike on /trails/kettle-ridge-loop from a hiking forum", "time": "Sep 21" } ] }};Remix
Remix this template
Describe what to change and the agent starts from Website analytics's files. The box is already started for you: finish “Start from Website analytics and …”
Dependencies
Documented from the template's package.json. The runtime has a prebuilt dependency set for Vite + React + TypeScript, so installs are fast.
- react^19.1.0
- react-dom^19.1.0
- vite^6.3.0
- @vitejs/plugin-react^4.4.0
- tailwindcss^4.1.0
- @tailwindcss/vite^4.1.0
- typescript^5.8.0
How it runs
- Framework
- Vite + React + TypeScript
- Dev command
- npm run dev
- Build command
- npm run build
- Output directory
- dist
- Port
- 5173
- Entry route
- /
Projects run in an isolated sandbox with a live preview. Read the projects documentation for settings, snapshots and deployment.
Keep browsing
All templates- Featured
Analytics dashboard
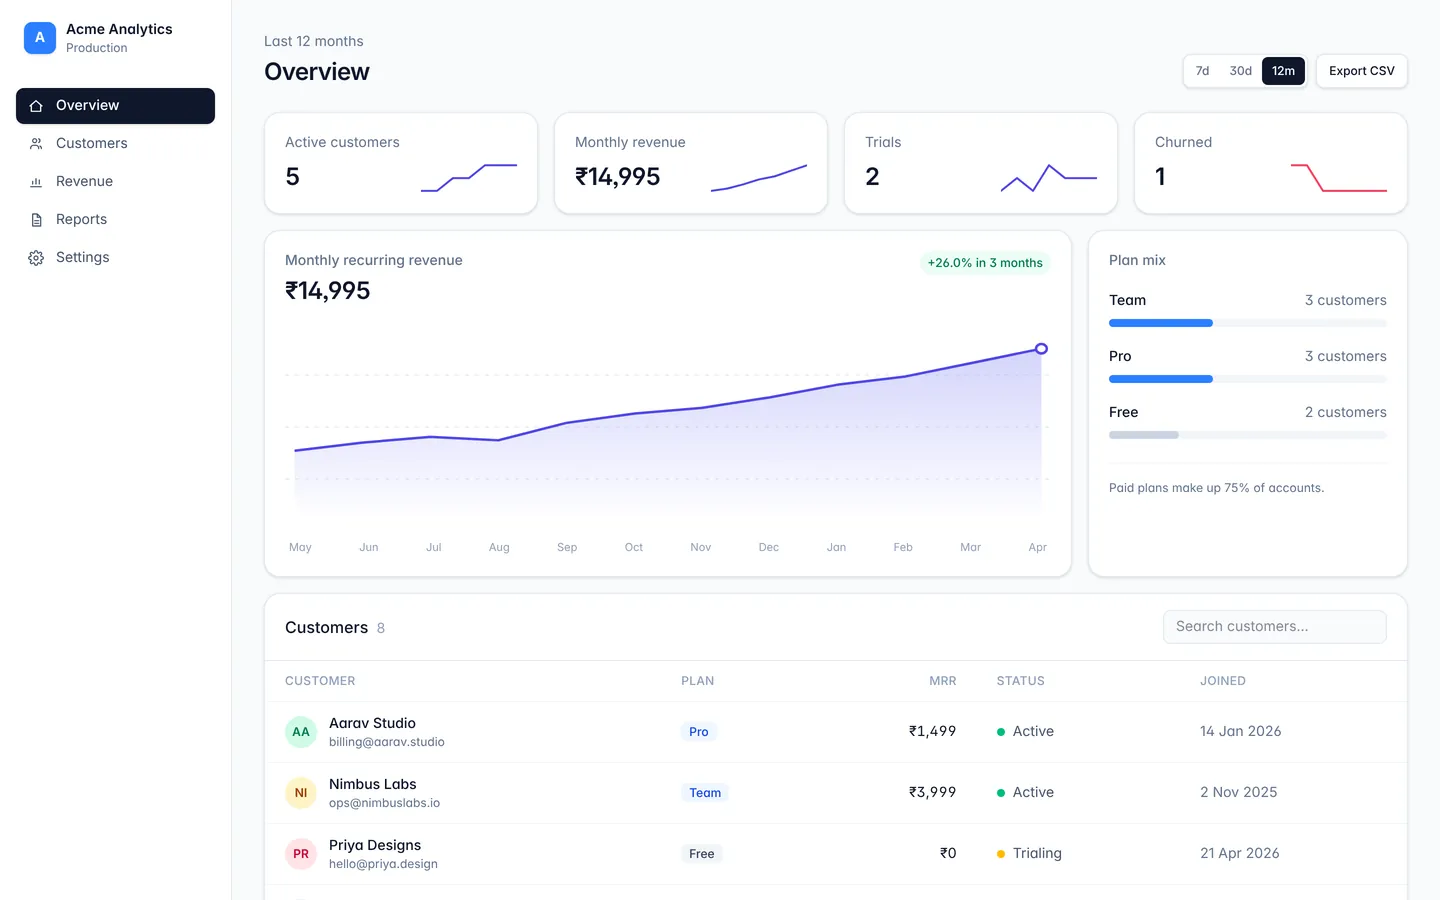
A responsive dashboard layout with sidebar navigation, stat cards, and a data table.
API monitoring
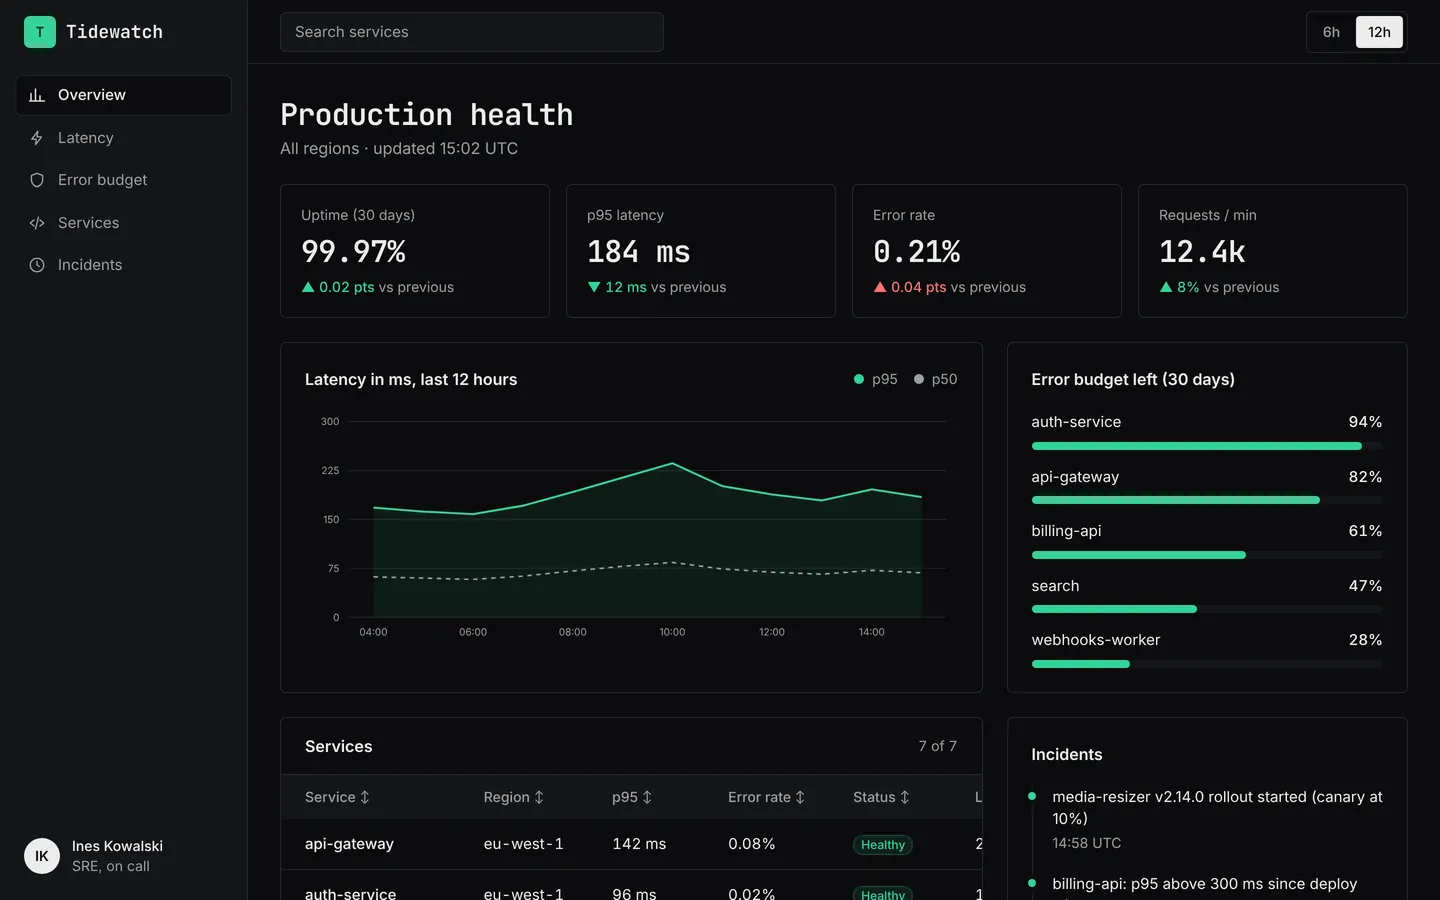
Latency, error rates, uptime and service health for an API platform, in a dark on-call layout.
SaaS metrics
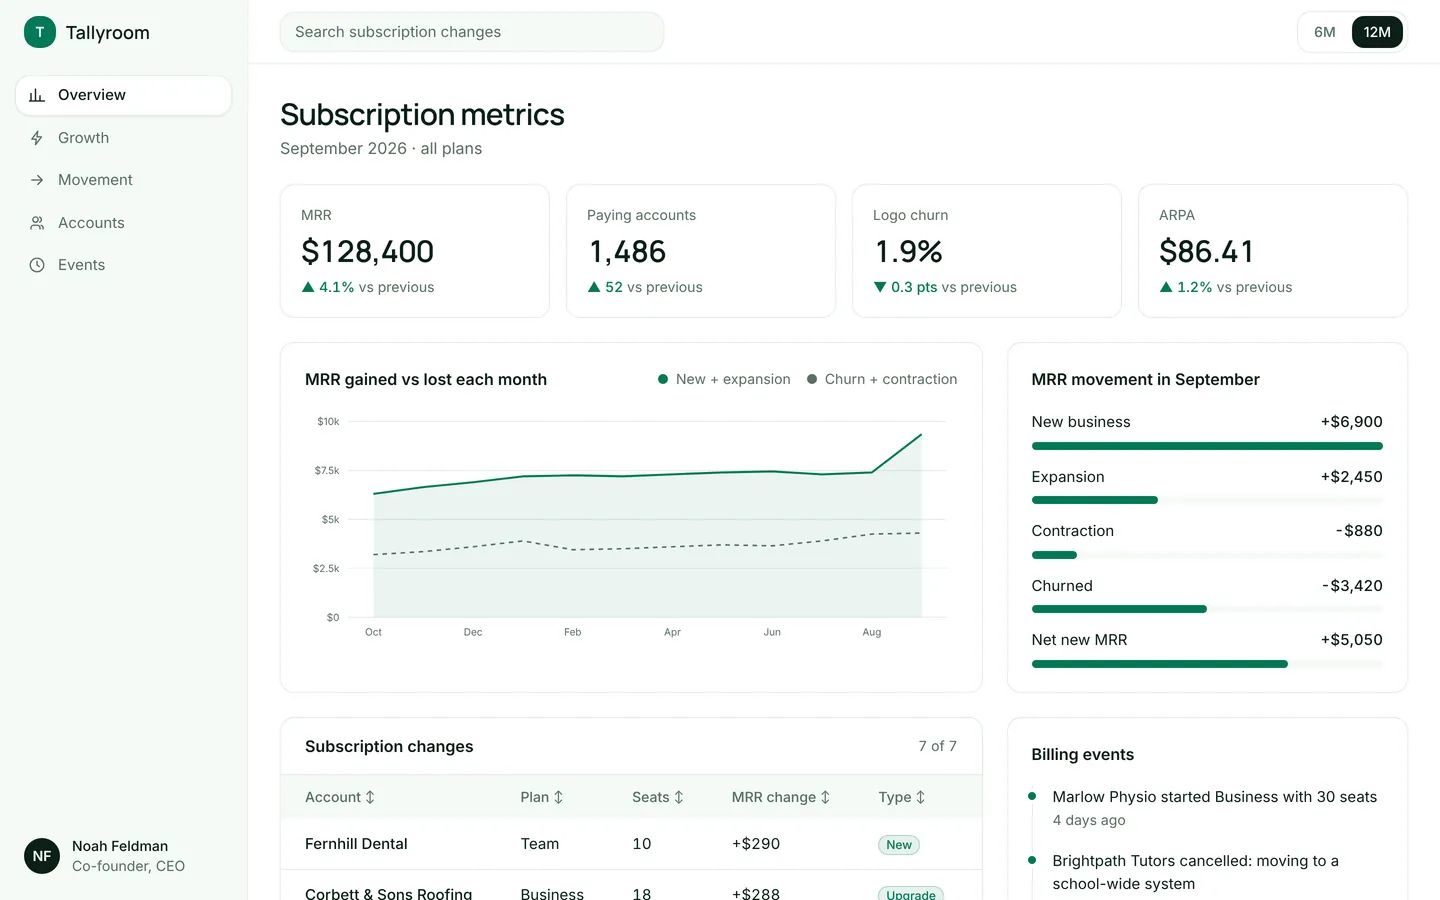
MRR, churn, ARPA and a breakdown of new, expansion and churned revenue for a subscription product.
Build on Website analytics
Create a free account, start from this template, and ask the AI agent to turn it into your app.