Dashboards · React
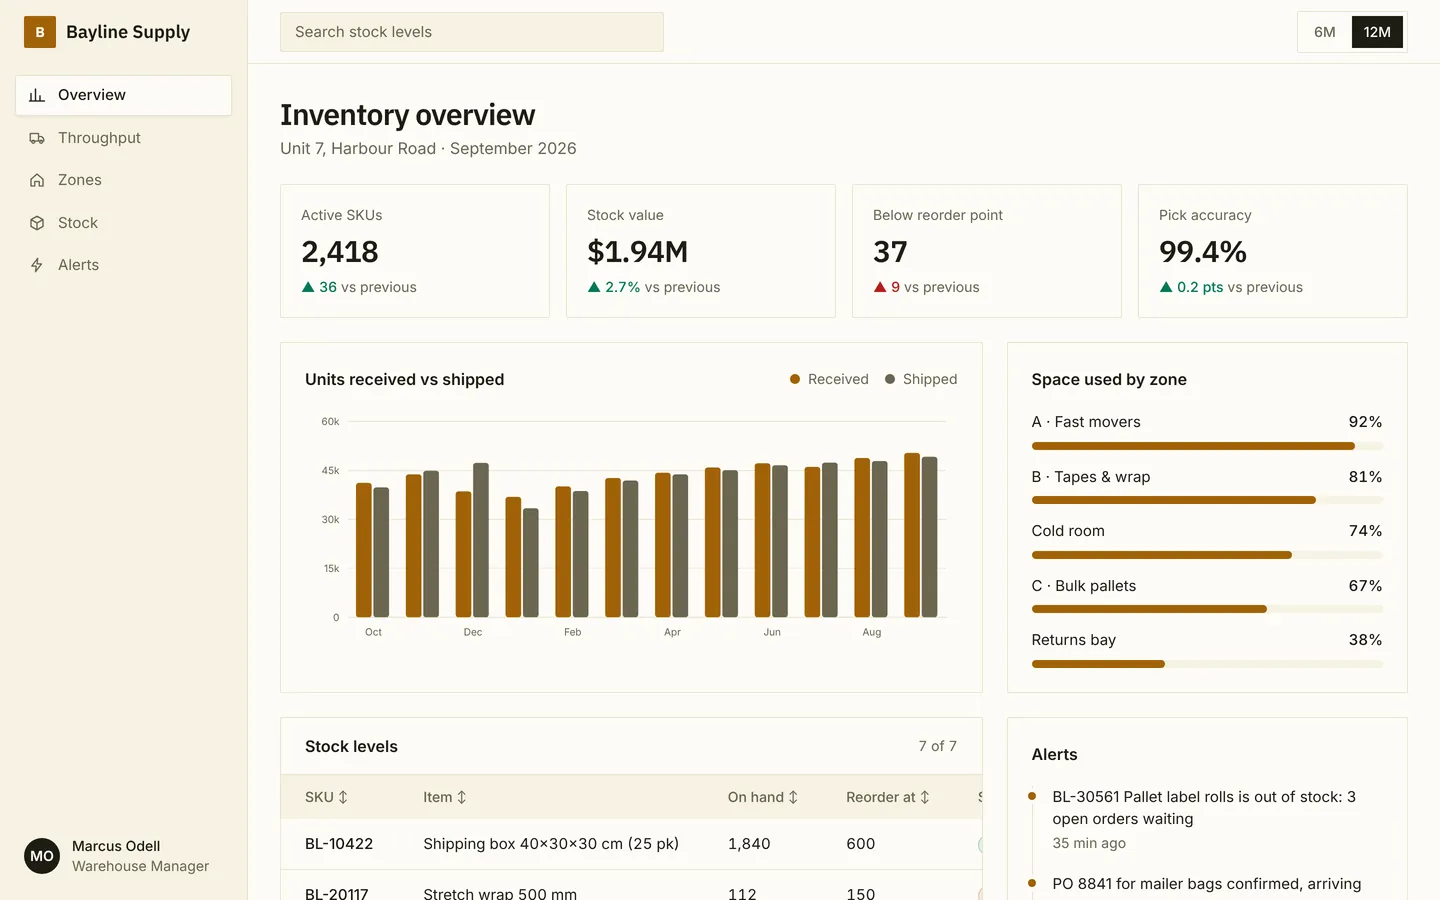
Warehouse inventory
Units received and shipped, zone capacity and low-stock alerts for a packaging supplies warehouse.
What you get
An inventory dashboard for a packaging supplies distributor: inbound and outbound units by month, how full each zone is, and stock levels against reorder points. SKUs, zones and numbers live in src/dashboard.ts.
Files
Exactly what is copied into a new project: 13 files, nothing generated.
Explorer 13
import { useState } from "react"; type Series = { name: string; values: number[] }; const COLORS = ["var(--color-accent)", "var(--color-muted)"];const W = 720;const H = 260;const PAD = { top: 16, right: 12, bottom: 28, left: 48 }; function niceMax(n: number) { if (n <= 0) return 1; const p = 10 ** Math.floor(Math.log10(n)); return Math.ceil(n / p) * p;} function fmt(n: number) { return Math.abs(n) >= 1000 ? `${+(n / 1000).toFixed(1)}k` : `${+n.toFixed(1)}`;} /** A dependency-free SVG line or bar chart with a hover readout. */export function Chart({ type, labels, series, unit = "" }: { type: "line" | "bar"; labels: string[]; series: Series[]; unit?: string }) { const [hover, setHover] = useState<number | null>(null); const max = niceMax(Math.max(...series.flatMap((s) => s.values))); const iw = W - PAD.left - PAD.right; const ih = H - PAD.top - PAD.bottom; const step = iw / labels.length; const x = (i: number) => PAD.left + step * i + step / 2; const y = (v: number) => PAD.top + ih - (v / max) * ih; const ticks = [0, 0.25, 0.5, 0.75, 1].map((t) => t * max); const every = Math.ceil(labels.length / 8); return ( <div className="relative"> <svg viewBox={`0 0 ${W} ${H}`} className="h-auto w-full" role="img" aria-label={`${series.map((s) => s.name).join(" and ")} by period`} onMouseLeave={() => setHover(null)}> {ticks.map((t) => ( <g key={t}> <line x1={PAD.left} x2={W - PAD.right} y1={y(t)} y2={y(t)} stroke="var(--color-line)" /> <text x={PAD.left - 10} y={y(t) + 4} textAnchor="end" fontSize="11" fill="var(--color-muted)"> {unit === "$" || unit === "€" || unit === "£" || unit === "₹" ? unit : ""} {fmt(t)} {unit === "%" ? "%" : ""} </text> </g> ))} {labels.map((l, i) => i % every === 0 ? ( <text key={l + i} x={x(i)} y={H - 8} textAnchor="middle" fontSize="11" fill="var(--color-muted)"> {l} </text> ) : null, )} {type === "bar" ? series.map((s, si) => s.values.map((v, i) => { const bw = Math.min(28, (step * 0.7) / series.length); const bx = x(i) - (bw * series.length) / 2 + bw * si; return <rect key={`${si}-${i}`} x={bx} y={y(v)} width={bw - 2} height={PAD.top + ih - y(v)} rx={3} fill={COLORS[si % COLORS.length]} opacity={hover === null || hover === i ? 1 : 0.45} />; }), ) : series.map((s, si) => { const d = s.values.map((v, i) => `${i ? "L" : "M"}${x(i).toFixed(1)},${y(v).toFixed(1)}`).join(" "); return ( <g key={s.name}> {si === 0 ? <path d={`${d} L${x(s.values.length - 1)},${PAD.top + ih} L${x(0)},${PAD.top + ih} Z`} fill="var(--color-accent)" opacity={0.08} /> : null} <path d={d} fill="none" stroke={COLORS[si % COLORS.length]} strokeWidth={si === 0 ? 2.25 : 1.75} strokeDasharray={si === 0 ? undefined : "5 5"} strokeLinejoin="round" /> {hover !== null ? <circle cx={x(hover)} cy={y(s.values[hover])} r={4} fill="var(--color-bg)" stroke={COLORS[si % COLORS.length]} strokeWidth={2} /> : null} </g> ); })} {hover !== null && type === "line" ? <line x1={x(hover)} x2={x(hover)} y1={PAD.top} y2={PAD.top + ih} stroke="var(--color-line)" /> : null} {labels.map((l, i) => ( <rect key={`hit-${l}-${i}`} x={PAD.left + step * i} y={PAD.top} width={step} height={ih} fill="transparent" onMouseEnter={() => setHover(i)} /> ))} </svg> {hover !== null ? ( <div className="pointer-events-none absolute top-2 rounded-card border border-line bg-bg px-3 py-2 text-sm shadow-lg" style={{ left: `${Math.min(80, (x(hover) / W) * 100)}%` }}> <p className="font-medium">{labels[hover]}</p> {series.map((s, si) => ( <p key={s.name} className="flex items-center gap-2 tabular-nums text-muted"> <span className="h-2 w-2 rounded-full" style={{ background: COLORS[si % COLORS.length] }} /> {s.name}: <span className="text-fg">{s.values[hover].toLocaleString()}</span> </p> ))} </div> ) : null} </div> );}Remix
Remix this template
Describe what to change and the agent starts from Warehouse inventory's files. The box is already started for you: finish “Start from Warehouse inventory and …”
Dependencies
Documented from the template's package.json. The runtime has a prebuilt dependency set for Vite + React + TypeScript, so installs are fast.
- react^19.1.0
- react-dom^19.1.0
- vite^6.3.0
- @vitejs/plugin-react^4.4.0
- tailwindcss^4.1.0
- @tailwindcss/vite^4.1.0
- typescript^5.8.0
How it runs
- Framework
- Vite + React + TypeScript
- Dev command
- npm run dev
- Build command
- npm run build
- Output directory
- dist
- Port
- 5173
- Entry route
- /
Projects run in an isolated sandbox with a live preview. Read the projects documentation for settings, snapshots and deployment.
Keep browsing
All templates- Featured
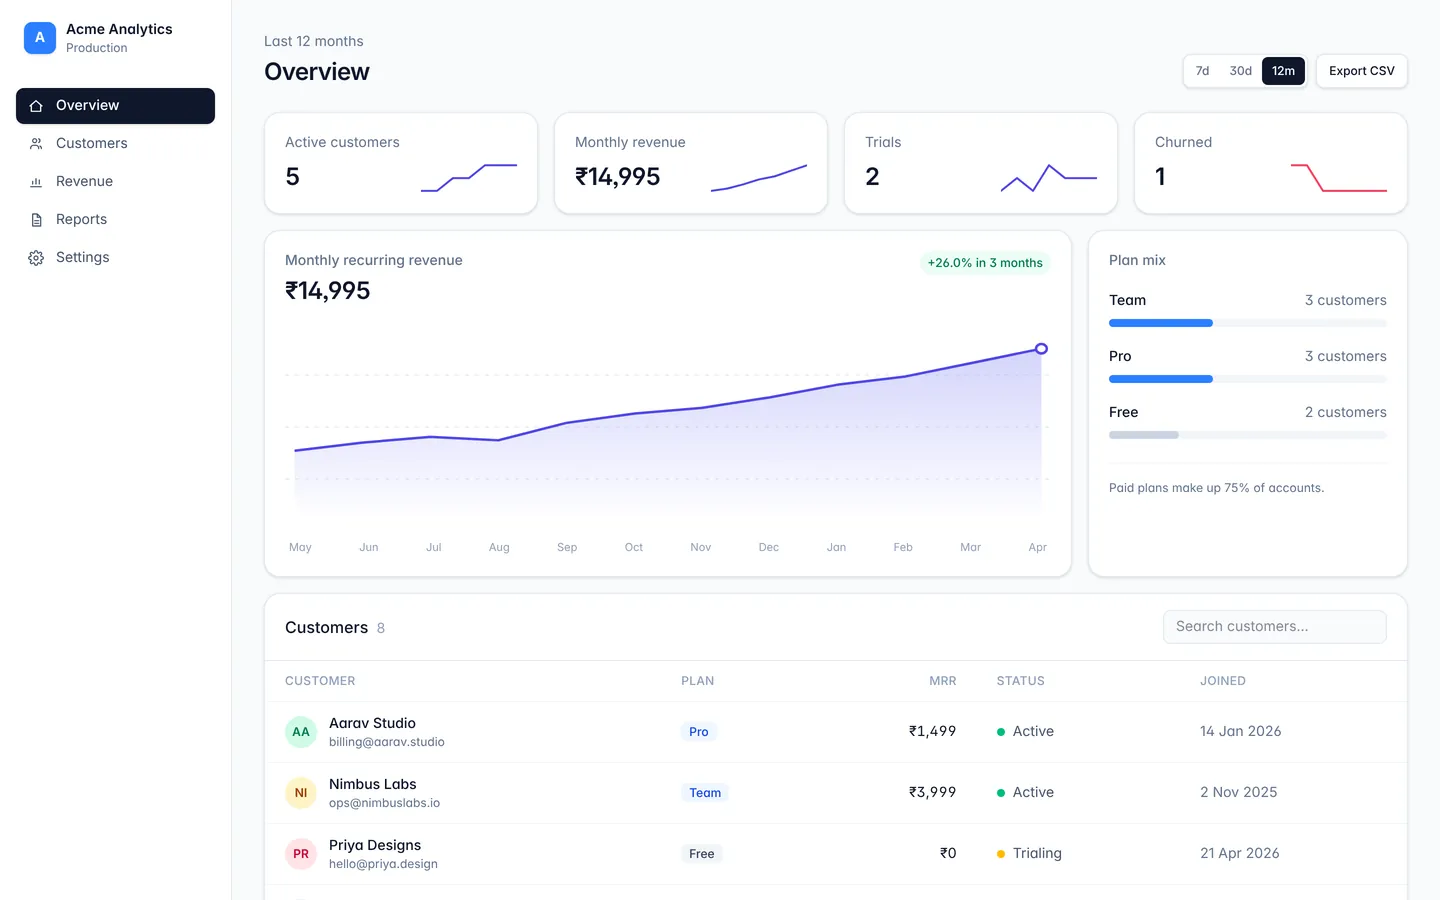
Analytics dashboard
A responsive dashboard layout with sidebar navigation, stat cards, and a data table.
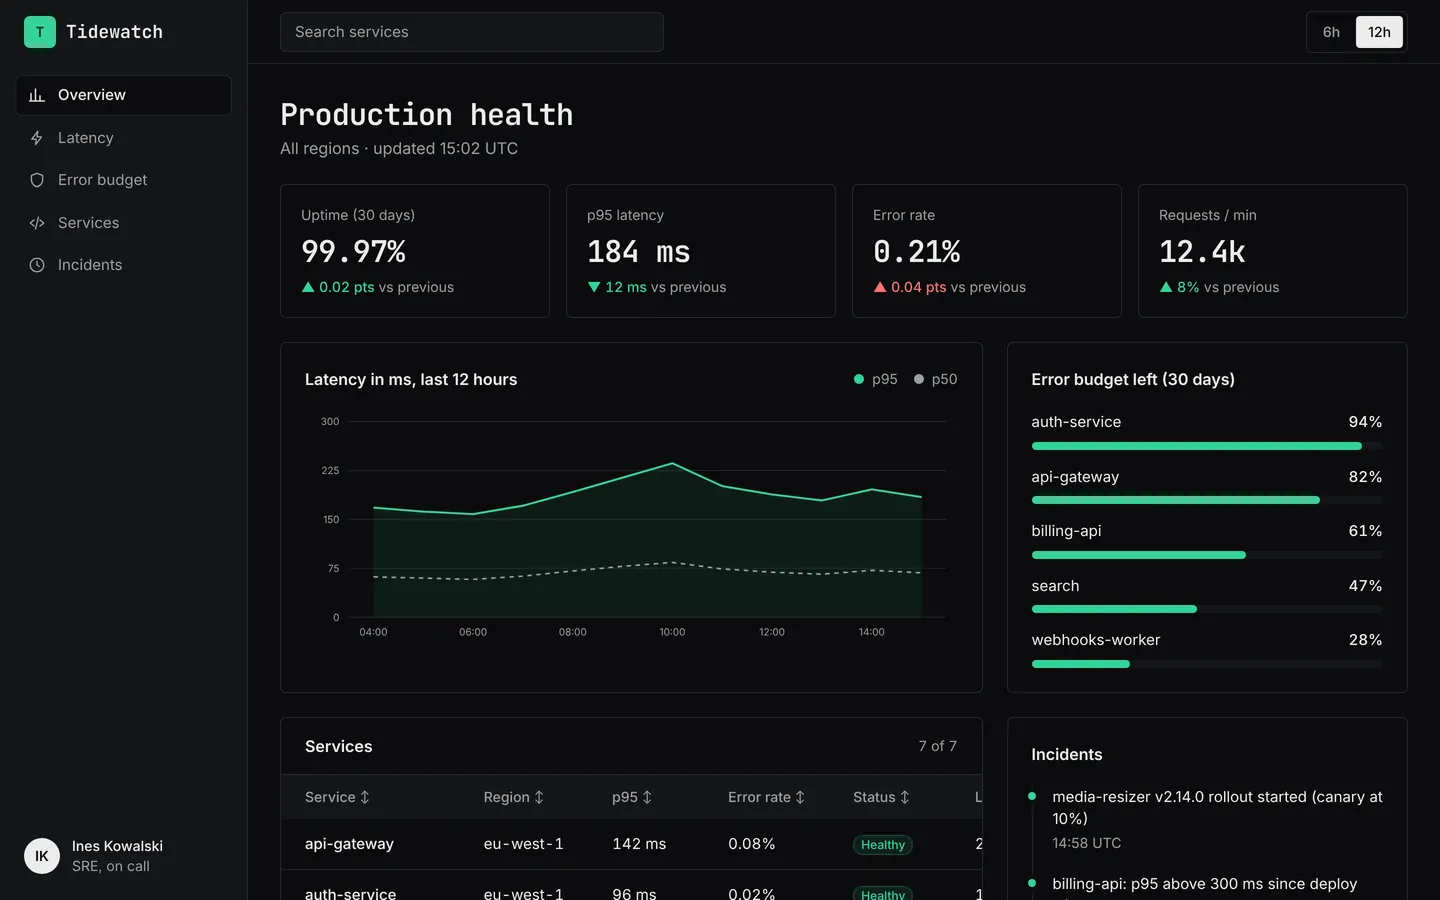
API monitoring
Latency, error rates, uptime and service health for an API platform, in a dark on-call layout.
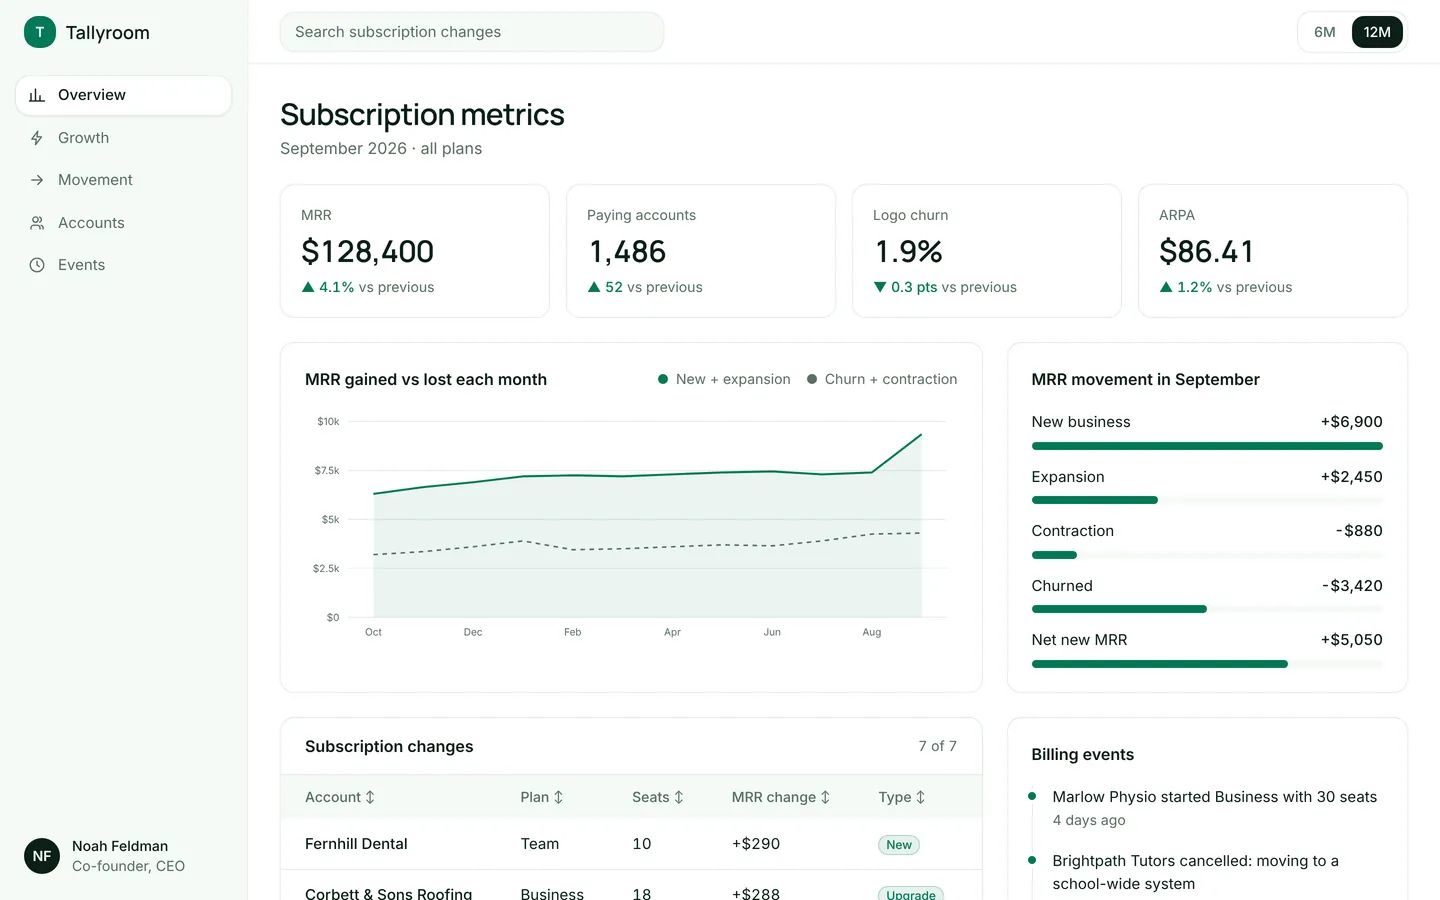
SaaS metrics
MRR, churn, ARPA and a breakdown of new, expansion and churned revenue for a subscription product.
Build on Warehouse inventory
Create a free account, start from this template, and ask the AI agent to turn it into your app.