Dashboards · React
Warehouse inventory
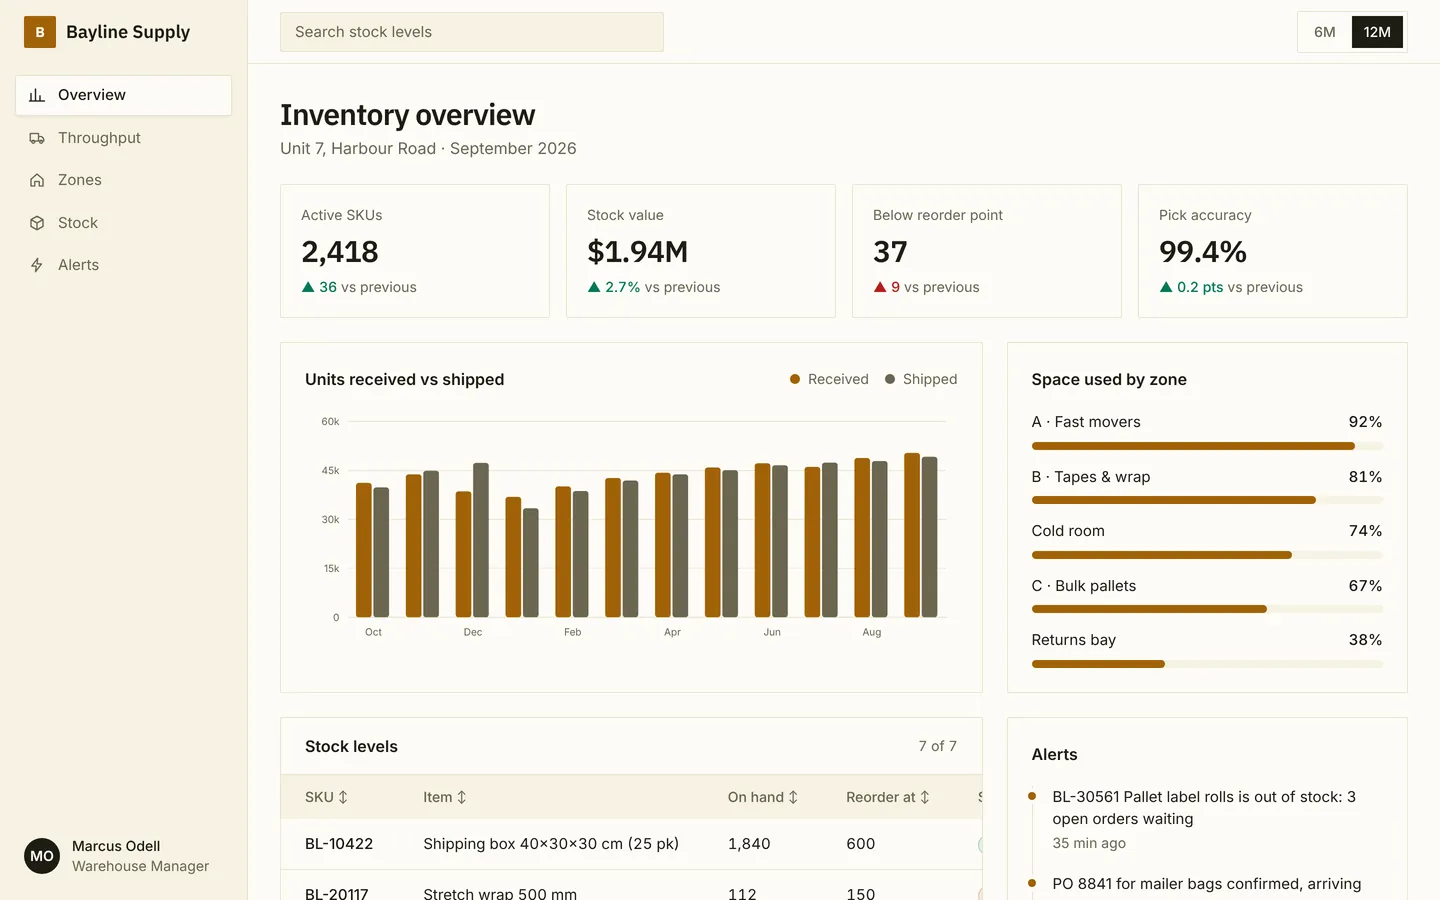
Units received and shipped, zone capacity and low-stock alerts for a packaging supplies warehouse.
What you get
An inventory dashboard for a packaging supplies distributor: inbound and outbound units by month, how full each zone is, and stock levels against reorder points. SKUs, zones and numbers live in src/dashboard.ts.
Files
Exactly what is copied into a new project: 13 files, nothing generated.
Explorer 13
import type { Dashboard } from "./types"; /** Everything this dashboard shows. Edit freely. */export const dashboard: Dashboard = { "brand": "Bayline Supply", "user": { "name": "Marcus Odell", "role": "Warehouse Manager" }, "nav": [ { "label": "Overview", "icon": "chart", "href": "#overview" }, { "label": "Throughput", "icon": "truck", "href": "#trends" }, { "label": "Zones", "icon": "home", "href": "#breakdown" }, { "label": "Stock", "icon": "box", "href": "#table" }, { "label": "Alerts", "icon": "bolt", "href": "#activity" } ], "title": "Inventory overview", "subtitle": "Unit 7, Harbour Road · September 2026", "ranges": [ { "label": "6M", "points": 6 }, { "label": "12M", "points": 12 } ], "kpis": [ { "label": "Active SKUs", "value": "2,418", "delta": "36", "up": true }, { "label": "Stock value", "value": "$1.94M", "delta": "2.7%", "up": true }, { "label": "Below reorder point", "value": "37", "delta": "9", "up": true, "upIsGood": false }, { "label": "Pick accuracy", "value": "99.4%", "delta": "0.2 pts", "up": true } ], "chart": { "title": "Units received vs shipped", "type": "bar", "labels": [ "Oct", "Nov", "Dec", "Jan", "Feb", "Mar", "Apr", "May", "Jun", "Jul", "Aug", "Sep" ], "series": [ { "name": "Received", "values": [ 41200, 43800, 38600, 36900, 40100, 42700, 44300, 45900, 47200, 46100, 48800, 50400 ] }, { "name": "Shipped", "values": [ 39800, 44900, 47300, 33400, 38700, 41900, 43800, 45100, 46600, 47400, 47900, 49200 ] } ] }, "side": { "title": "Space used by zone", "items": [ { "label": "A · Fast movers", "value": "92%", "pct": 92 }, { "label": "B · Tapes & wrap", "value": "81%", "pct": 81 }, { "label": "Cold room", "value": "74%", "pct": 74 }, { "label": "C · Bulk pallets", "value": "67%", "pct": 67 }, { "label": "Returns bay", "value": "38%", "pct": 38 } ] }, "table": { "title": "Stock levels", "columns": [ "SKU", "Item", "On hand", "Reorder at", "Status", "Bin" ], "statusColumn": 4, "tones": { "In stock": "good", "Low": "warn", "Reorder placed": "accent", "Out of stock": "bad" }, "rows": [ [ "BL-10422", "Shipping box 40×30×30 cm (25 pk)", "1,840", "600", "In stock", "A-04-2" ], [ "BL-20117", "Stretch wrap 500 mm", "112", "150", "Low", "B-11-1" ], [ "BL-30561", "Pallet label rolls", "0", "80", "Out of stock", "A-09-3" ], [ "BL-10388", "Mailer bag 300×400 mm (100 pk)", "260", "400", "Reorder placed", "A-02-1" ], [ "BL-41203", "Nitrile gloves, L (box of 100)", "3,420", "1,000", "In stock", "C-03-4" ], [ "BL-22950", "Packing tape 48 mm", "96", "120", "Low", "B-07-2" ], [ "BL-50014", "Gel ice pack 500 g", "740", "300", "In stock", "COLD-1" ] ] }, "feed": { "title": "Alerts", "items": [ { "text": "BL-30561 Pallet label rolls is out of stock: 3 open orders waiting", "time": "35 min ago" }, { "text": "PO 8841 for mailer bags confirmed, arriving Oct 3", "time": "Yesterday" }, { "text": "Zone A is over 90% full: move slow sellers to zone C", "time": "2 days ago" } ] }};Remix
Remix this template
Describe what to change and the agent starts from Warehouse inventory's files. The box is already started for you: finish “Start from Warehouse inventory and …”
Dependencies
Documented from the template's package.json. The runtime has a prebuilt dependency set for Vite + React + TypeScript, so installs are fast.
- react^19.1.0
- react-dom^19.1.0
- vite^6.3.0
- @vitejs/plugin-react^4.4.0
- tailwindcss^4.1.0
- @tailwindcss/vite^4.1.0
- typescript^5.8.0
How it runs
- Framework
- Vite + React + TypeScript
- Dev command
- npm run dev
- Build command
- npm run build
- Output directory
- dist
- Port
- 5173
- Entry route
- /
Projects run in an isolated sandbox with a live preview. Read the projects documentation for settings, snapshots and deployment.
Keep browsing
All templates- Featured
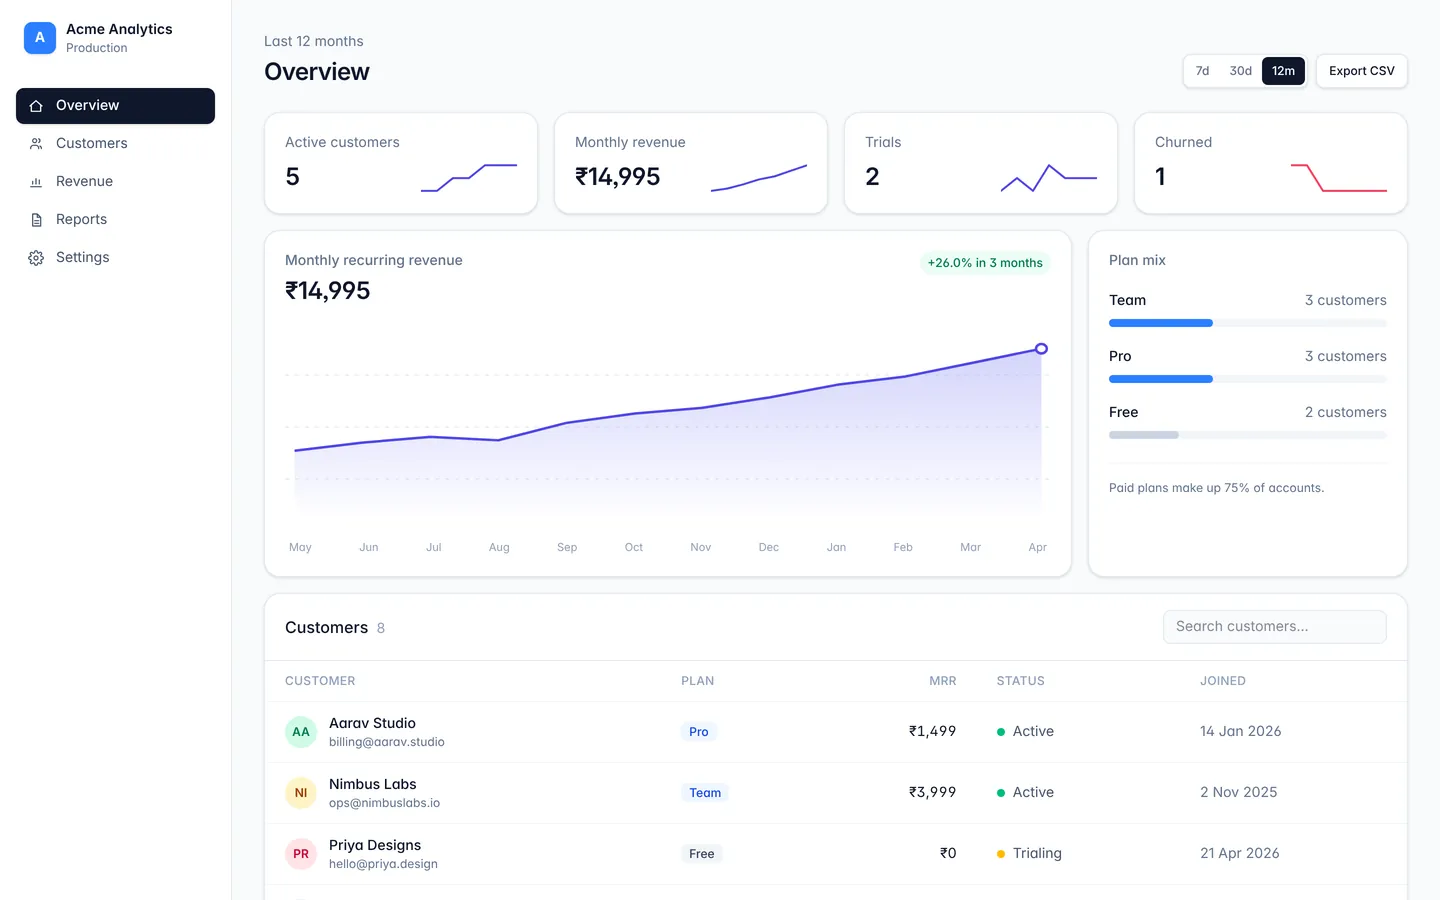
Analytics dashboard
A responsive dashboard layout with sidebar navigation, stat cards, and a data table.
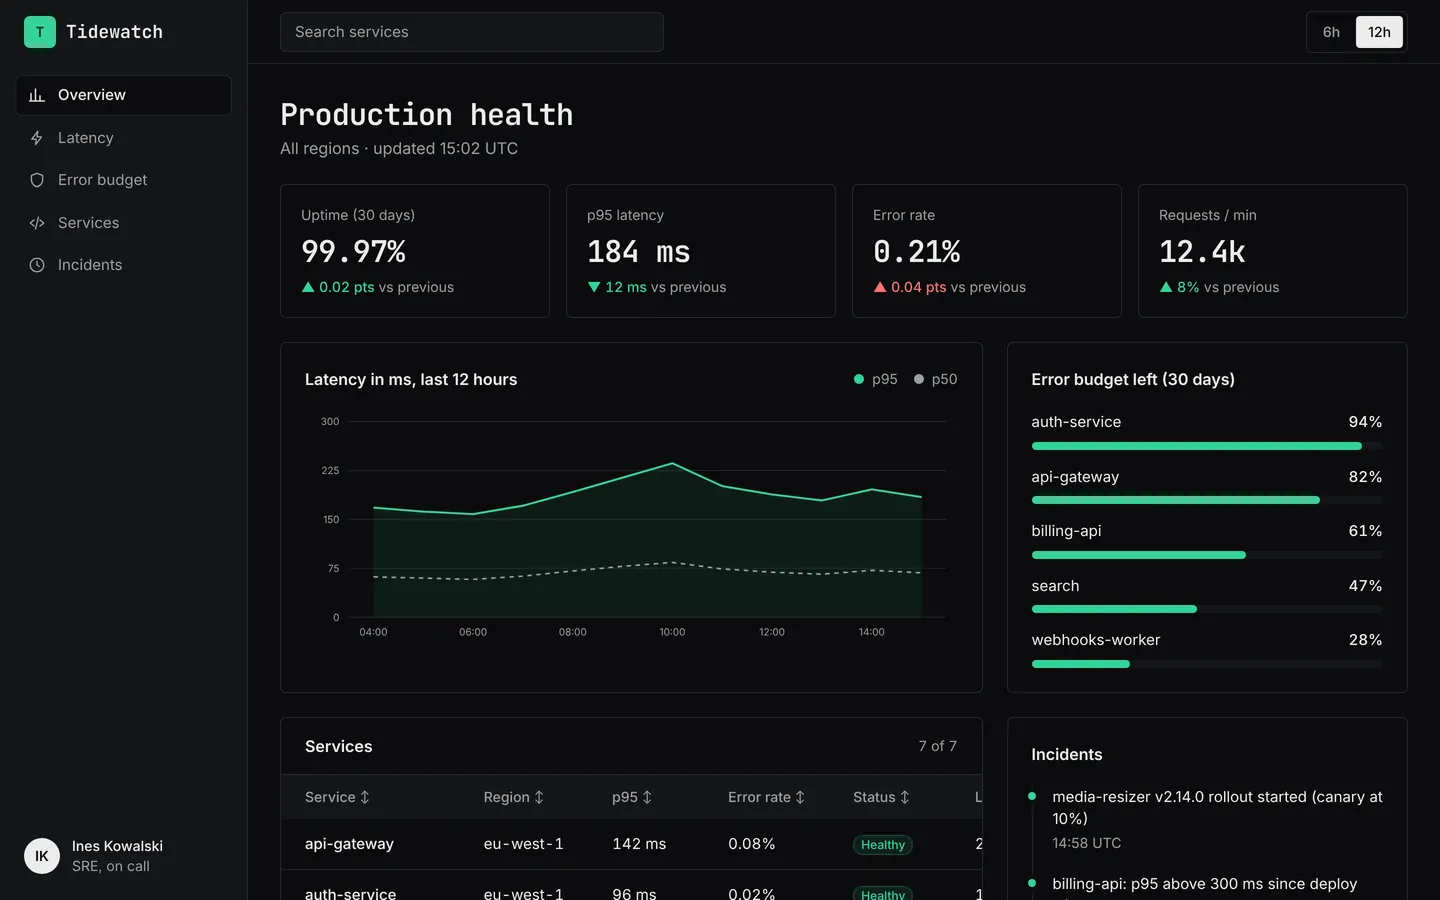
API monitoring
Latency, error rates, uptime and service health for an API platform, in a dark on-call layout.
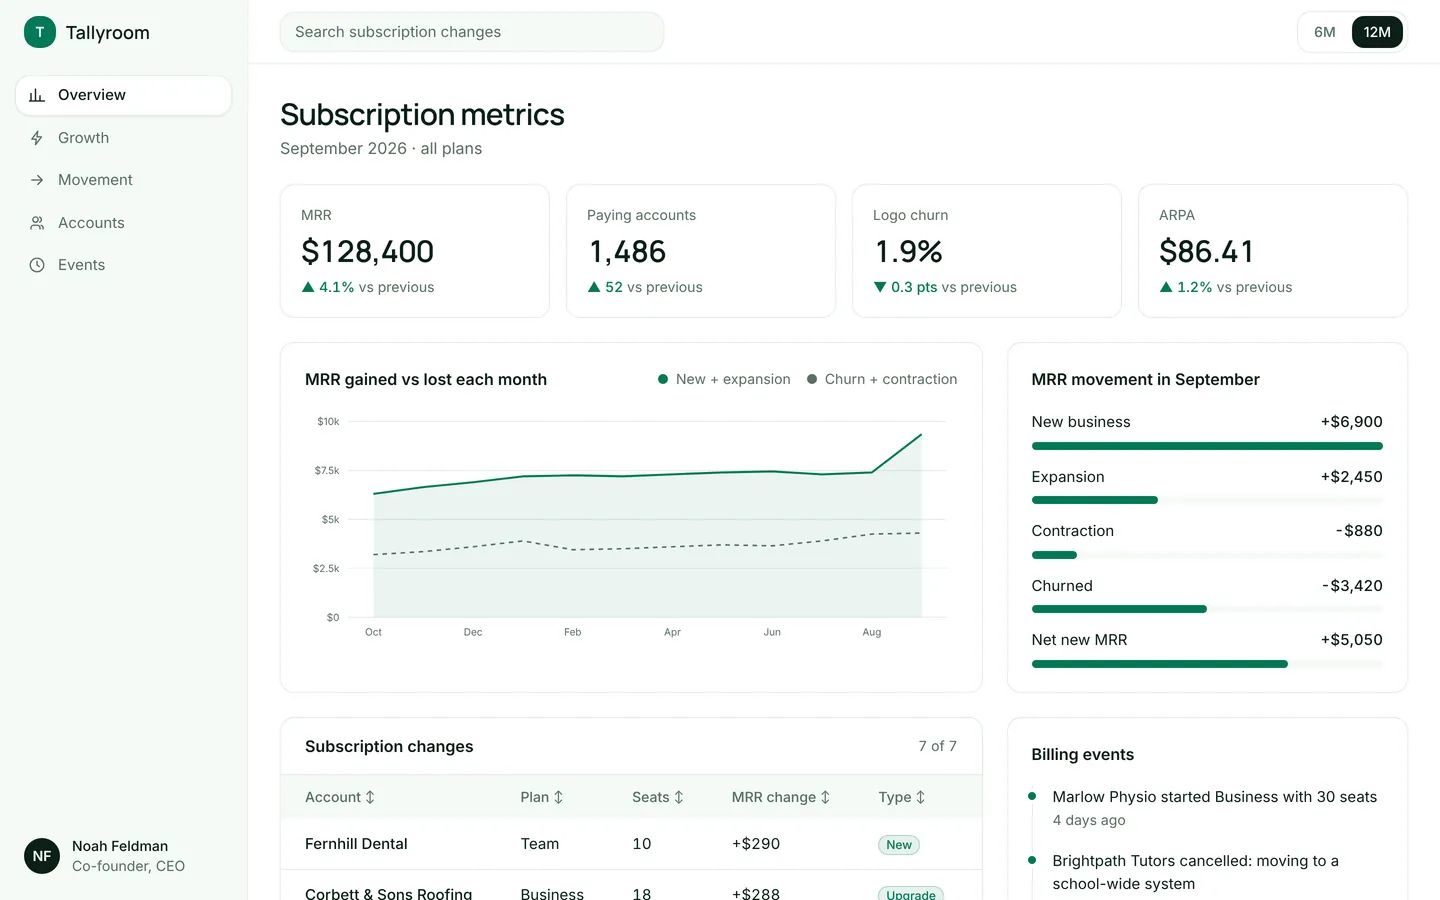
SaaS metrics
MRR, churn, ARPA and a breakdown of new, expansion and churned revenue for a subscription product.
Build on Warehouse inventory
Create a free account, start from this template, and ask the AI agent to turn it into your app.