Dashboards · React
Support desk
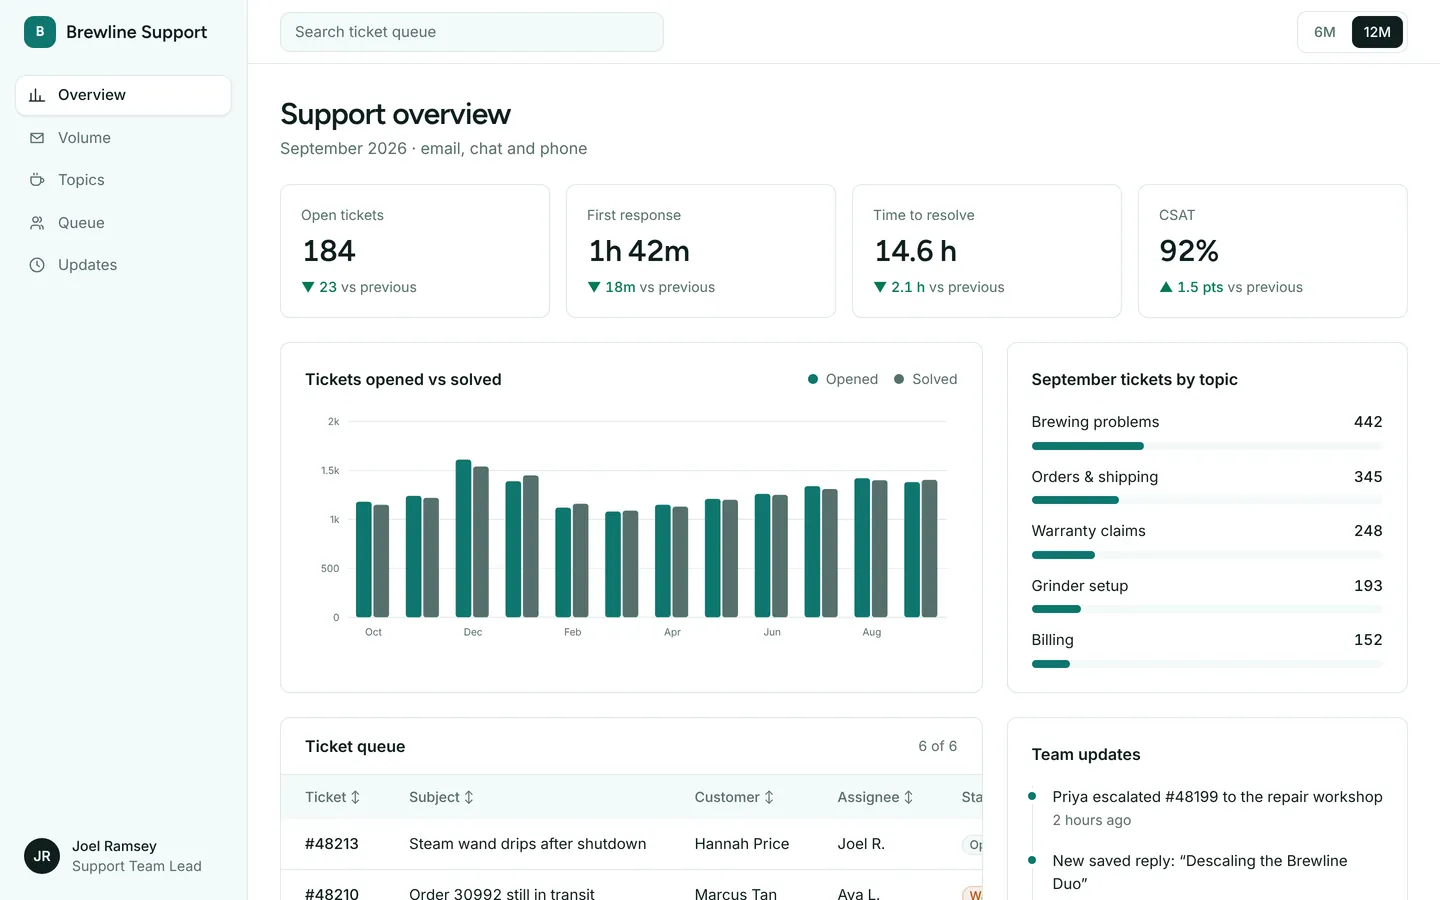
Ticket volume, response times, satisfaction and an open-ticket queue for a customer support team.
What you get
A help desk dashboard for an espresso machine maker: tickets opened and solved each month, what customers write in about, and the current queue with assignees and status. Tickets and metrics live in src/dashboard.ts.
Files
Exactly what is copied into a new project: 13 files, nothing generated.
Explorer 13
import type { Dashboard } from "./types"; /** Everything this dashboard shows. Edit freely. */export const dashboard: Dashboard = { "brand": "Brewline Support", "user": { "name": "Joel Ramsey", "role": "Support Team Lead" }, "nav": [ { "label": "Overview", "icon": "chart", "href": "#overview" }, { "label": "Volume", "icon": "mail", "href": "#trends" }, { "label": "Topics", "icon": "cup", "href": "#breakdown" }, { "label": "Queue", "icon": "users", "href": "#table" }, { "label": "Updates", "icon": "clock", "href": "#activity" } ], "title": "Support overview", "subtitle": "September 2026 · email, chat and phone", "ranges": [ { "label": "6M", "points": 6 }, { "label": "12M", "points": 12 } ], "kpis": [ { "label": "Open tickets", "value": "184", "delta": "23", "up": false, "upIsGood": false }, { "label": "First response", "value": "1h 42m", "delta": "18m", "up": false, "upIsGood": false }, { "label": "Time to resolve", "value": "14.6 h", "delta": "2.1 h", "up": false, "upIsGood": false }, { "label": "CSAT", "value": "92%", "delta": "1.5 pts", "up": true } ], "chart": { "title": "Tickets opened vs solved", "type": "bar", "labels": [ "Oct", "Nov", "Dec", "Jan", "Feb", "Mar", "Apr", "May", "Jun", "Jul", "Aug", "Sep" ], "series": [ { "name": "Opened", "values": [ 1180, 1240, 1610, 1390, 1120, 1080, 1150, 1210, 1260, 1340, 1420, 1380 ] }, { "name": "Solved", "values": [ 1150, 1220, 1540, 1450, 1160, 1090, 1130, 1200, 1250, 1310, 1400, 1403 ] } ] }, "side": { "title": "September tickets by topic", "items": [ { "label": "Brewing problems", "value": "442", "pct": 32 }, { "label": "Orders & shipping", "value": "345", "pct": 25 }, { "label": "Warranty claims", "value": "248", "pct": 18 }, { "label": "Grinder setup", "value": "193", "pct": 14 }, { "label": "Billing", "value": "152", "pct": 11 } ] }, "table": { "title": "Ticket queue", "columns": [ "Ticket", "Subject", "Customer", "Assignee", "Status", "Updated" ], "statusColumn": 4, "tones": { "New": "accent", "Open": "neutral", "Waiting": "warn", "Escalated": "bad", "Solved": "good" }, "rows": [ [ "#48213", "Steam wand drips after shutdown", "Hannah Price", "Joel R.", "Open", "12 min ago" ], [ "#48210", "Order 30992 still in transit", "Marcus Tan", "Ava L.", "Waiting", "40 min ago" ], [ "#48207", "Replacing grinder burrs", "Sofia Greco", "Joel R.", "New", "1 h ago" ], [ "#48199", "Boiler error E04 on startup", "Ben Carter", "Priya N.", "Escalated", "2 h ago" ], [ "#48194", "Charged twice for descaler", "Ruth Adler", "Ava L.", "Open", "3 h ago" ], [ "#48188", "Which portafilter gasket size?", "Ivan Dimitrov", "Priya N.", "Solved", "5 h ago" ] ] }, "feed": { "title": "Team updates", "items": [ { "text": "Priya escalated #48199 to the repair workshop", "time": "2 hours ago" }, { "text": "New saved reply: “Descaling the Brewline Duo”", "time": "Yesterday" }, { "text": "Weekend chat hours extended to 6 pm", "time": "Sep 22" } ] }};Remix
Remix this template
Describe what to change and the agent starts from Support desk's files. The box is already started for you: finish “Start from Support desk and …”
Dependencies
Documented from the template's package.json. The runtime has a prebuilt dependency set for Vite + React + TypeScript, so installs are fast.
- react^19.1.0
- react-dom^19.1.0
- vite^6.3.0
- @vitejs/plugin-react^4.4.0
- tailwindcss^4.1.0
- @tailwindcss/vite^4.1.0
- typescript^5.8.0
How it runs
- Framework
- Vite + React + TypeScript
- Dev command
- npm run dev
- Build command
- npm run build
- Output directory
- dist
- Port
- 5173
- Entry route
- /
Projects run in an isolated sandbox with a live preview. Read the projects documentation for settings, snapshots and deployment.
Keep browsing
All templates- Featured
Analytics dashboard
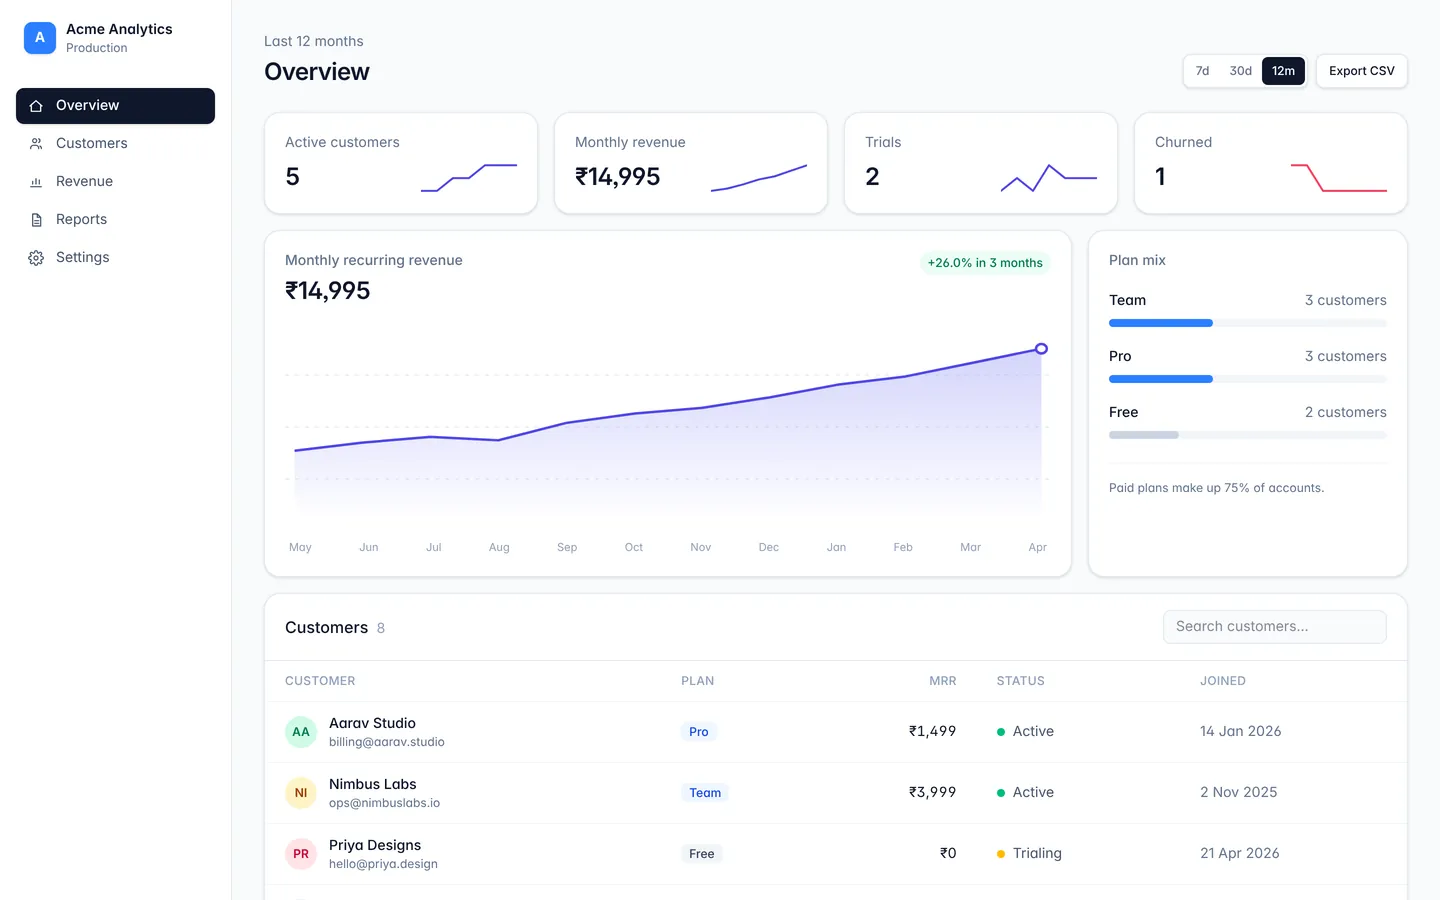
A responsive dashboard layout with sidebar navigation, stat cards, and a data table.
API monitoring
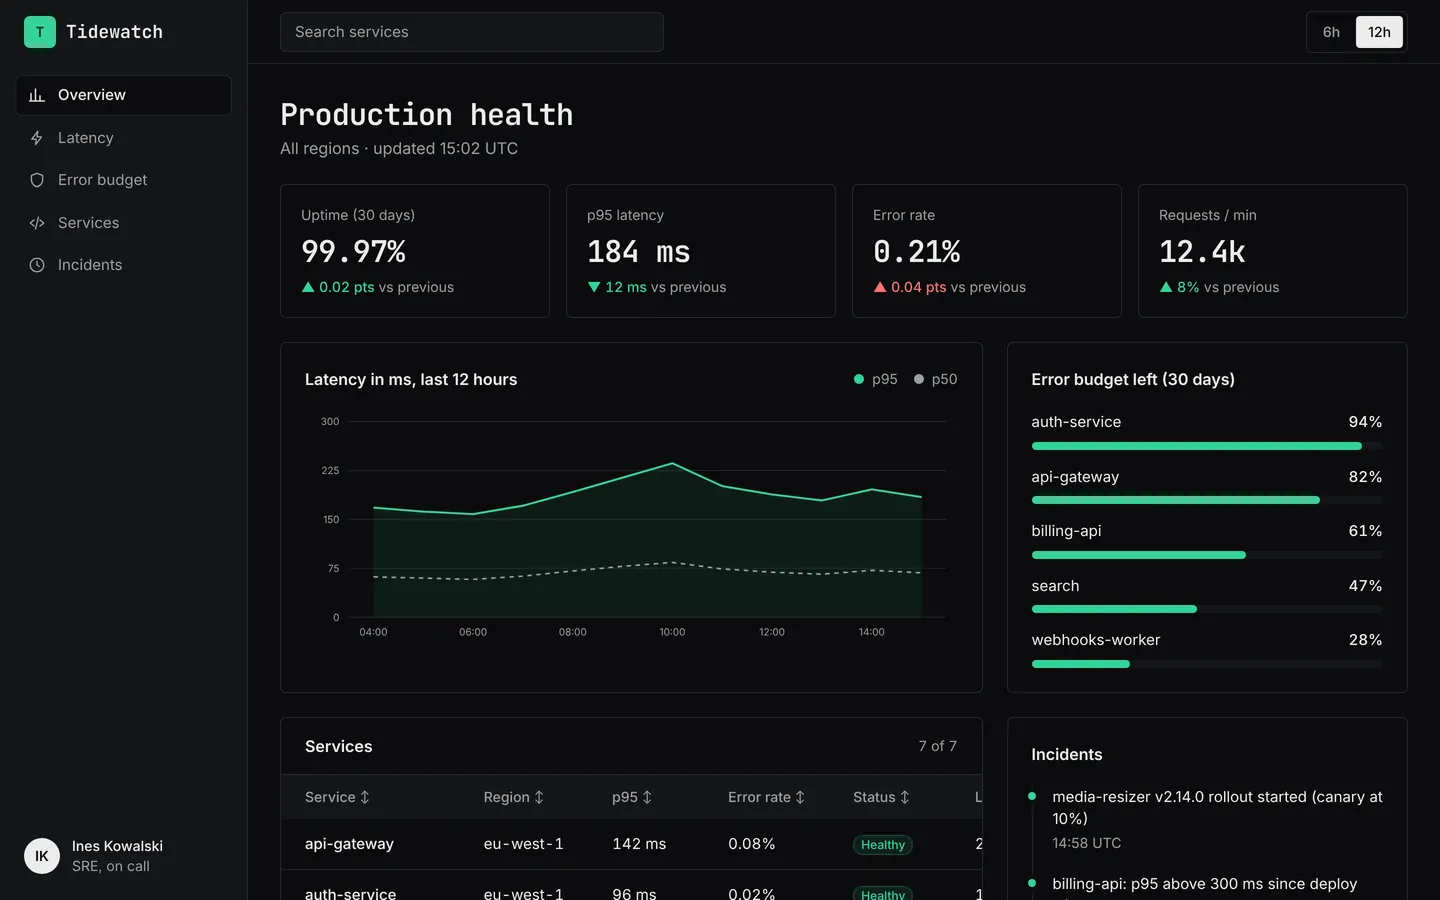
Latency, error rates, uptime and service health for an API platform, in a dark on-call layout.
SaaS metrics
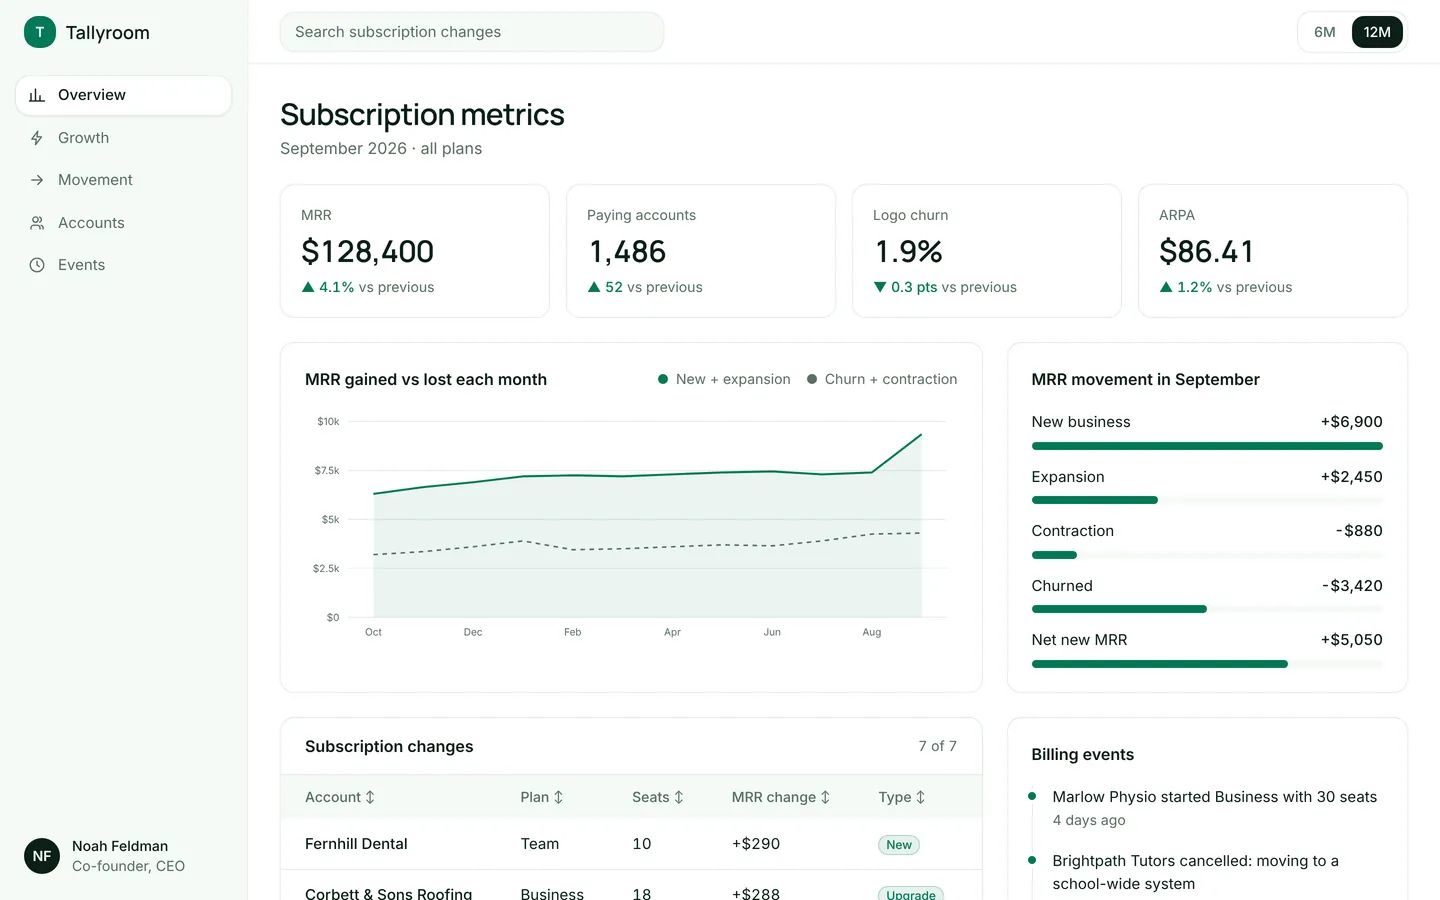
MRR, churn, ARPA and a breakdown of new, expansion and churned revenue for a subscription product.
Build on Support desk
Create a free account, start from this template, and ask the AI agent to turn it into your app.