Portfolios · React
Data scientist
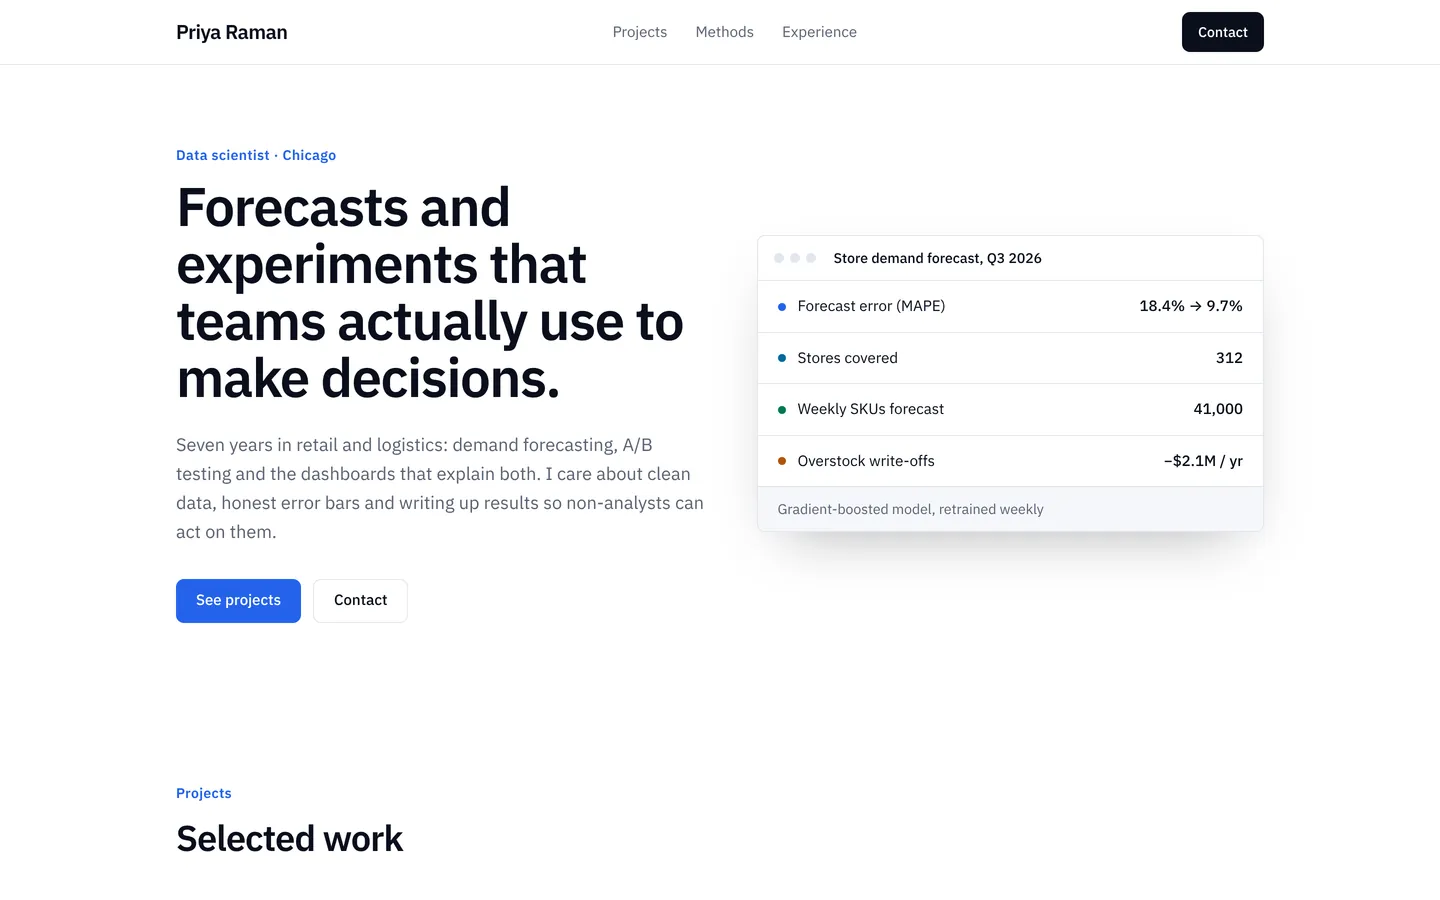
Crisp portfolio for a data scientist, with projects, methods, results, experience and references.
What you get
A structured portfolio for a data scientist or analyst: a results snapshot, selected projects, the methods they use, a stats band, an experience timeline, references and a contact form. All content lives in src/site.ts.
Files
Exactly what is copied into a new project: 13 files, nothing generated.
Explorer 13
import type { Site } from "./types"; /** Everything this site shows. Edit freely. */export const site: Site = { "brand": "Priya Raman", "nav": [ { "label": "Projects", "href": "#projects" }, { "label": "Methods", "href": "#methods" }, { "label": "Experience", "href": "#experience" } ], "navCta": { "label": "Contact", "href": "#contact" }, "sections": [ { "kind": "hero", "variant": "split", "eyebrow": "Data scientist · Chicago", "title": "Forecasts and experiments that teams actually use to make decisions.", "text": "Seven years in retail and logistics: demand forecasting, A/B testing and the dashboards that explain both. I care about clean data, honest error bars and writing up results so non-analysts can act on them.", "primary": { "label": "See projects", "href": "#projects" }, "secondary": { "label": "Contact", "href": "#contact" }, "visual": { "type": "mock", "title": "Store demand forecast, Q3 2026", "rows": [ { "label": "Forecast error (MAPE)", "value": "18.4% → 9.7%" }, { "label": "Stores covered", "value": "312", "tone": "#0369a1" }, { "label": "Weekly SKUs forecast", "value": "41,000", "tone": "#047857" }, { "label": "Overstock write-offs", "value": "−$2.1M / yr", "tone": "#b45309" } ], "footer": "Gradient-boosted model, retrained weekly" } }, { "kind": "projects", "id": "projects", "eyebrow": "Projects", "title": "Selected work", "items": [ { "title": "Store demand forecasting", "tag": "Weekly forecasts for 312 grocery stores", "year": "2026", "tone": "#1e3a8a" }, { "title": "Experimentation platform", "tag": "Shared A/B test analysis for 9 product teams", "year": "2025", "tone": "#0f172a" }, { "title": "Delivery time estimates", "tag": "ETA model for a regional courier network", "year": "2023", "tone": "#0c4a6e" }, { "title": "Churn early warning", "tag": "Risk scores and a playbook for the support team", "year": "2022", "tone": "#334155" } ] }, { "kind": "features", "id": "methods", "eyebrow": "Methods", "title": "What I'm good at", "columns": 3, "items": [ { "title": "Forecasting", "text": "Hierarchical time series, gradient boosting, and knowing when a moving average is enough.", "icon": "chart" }, { "title": "Experiments", "text": "Test design, power calculations, CUPED and explaining p-values without the hand-waving.", "icon": "bolt" }, { "title": "Data engineering", "text": "SQL, dbt and Python pipelines that are tested, documented and boring to run.", "icon": "code" } ] }, { "kind": "stats", "items": [ { "value": "7 yrs", "label": "In industry" }, { "value": "120+", "label": "A/B tests analysed" }, { "value": "9", "label": "Teams supported" }, { "value": "3", "label": "Internal talks a year" } ] }, { "kind": "timeline", "id": "experience", "eyebrow": "Experience", "title": "Experience", "items": [ { "period": "2024 – now", "title": "Senior data scientist, Grainfield Markets", "text": "Lead forecasting for a 312-store grocery chain. Manage two analysts." }, { "period": "2021 – 2024", "title": "Data scientist, Parcelpoint", "text": "ETA and capacity models for a courier network; built the experimentation platform." }, { "period": "2019 – 2021", "title": "Analyst, Halsted Insurance", "text": "Churn and pricing analysis, SQL reporting and the first ML model in production." }, { "period": "2017 – 2019", "title": "MS Statistics, University of Illinois", "text": "Thesis on forecast reconciliation for hierarchical sales data." } ] }, { "kind": "quotes", "eyebrow": "References", "title": "What colleagues say", "items": [ { "quote": "Priya's write-ups are the only analysis docs our merchants read to the end.", "name": "Greg T.", "role": "VP, merchandising" }, { "quote": "She told us a test was inconclusive when we wanted it to win. That's why we trust her.", "name": "Nadia H.", "role": "Product lead" }, { "quote": "The forecasting pipeline she built has run every Monday for two years without a page.", "name": "Owen C.", "role": "Data engineering manager" } ] }, { "kind": "contact", "eyebrow": "Contact", "title": "Get in touch", "text": "Open to senior and lead roles in forecasting or experimentation, and to speaking at meetups in the Midwest.", "fields": [ "name", "email", "company", "message" ], "button": "Send message" } ], "footer": { "text": "Priya Raman, data scientist in Chicago.", "columns": [ { "title": "Elsewhere", "links": [ "GitHub", "LinkedIn", "Kaggle" ] }, { "title": "Writing", "links": [ "Blog", "Talks" ] } ], "legal": "© Priya Raman. Sample content: replace it in src/site.ts." }};Remix
Remix this template
Describe what to change and the agent starts from Data scientist's files. The box is already started for you: finish “Start from Data scientist and …”
Dependencies
Documented from the template's package.json. The runtime has a prebuilt dependency set for Vite + React + TypeScript, so installs are fast.
- react^19.1.0
- react-dom^19.1.0
- vite^6.3.0
- @vitejs/plugin-react^4.4.0
- tailwindcss^4.1.0
- @tailwindcss/vite^4.1.0
- typescript^5.8.0
How it runs
- Framework
- Vite + React + TypeScript
- Dev command
- npm run dev
- Build command
- npm run build
- Output directory
- dist
- Port
- 5173
- Entry route
- /
Projects run in an isolated sandbox with a live preview. Read the projects documentation for settings, snapshots and deployment.
Keep browsing
All templates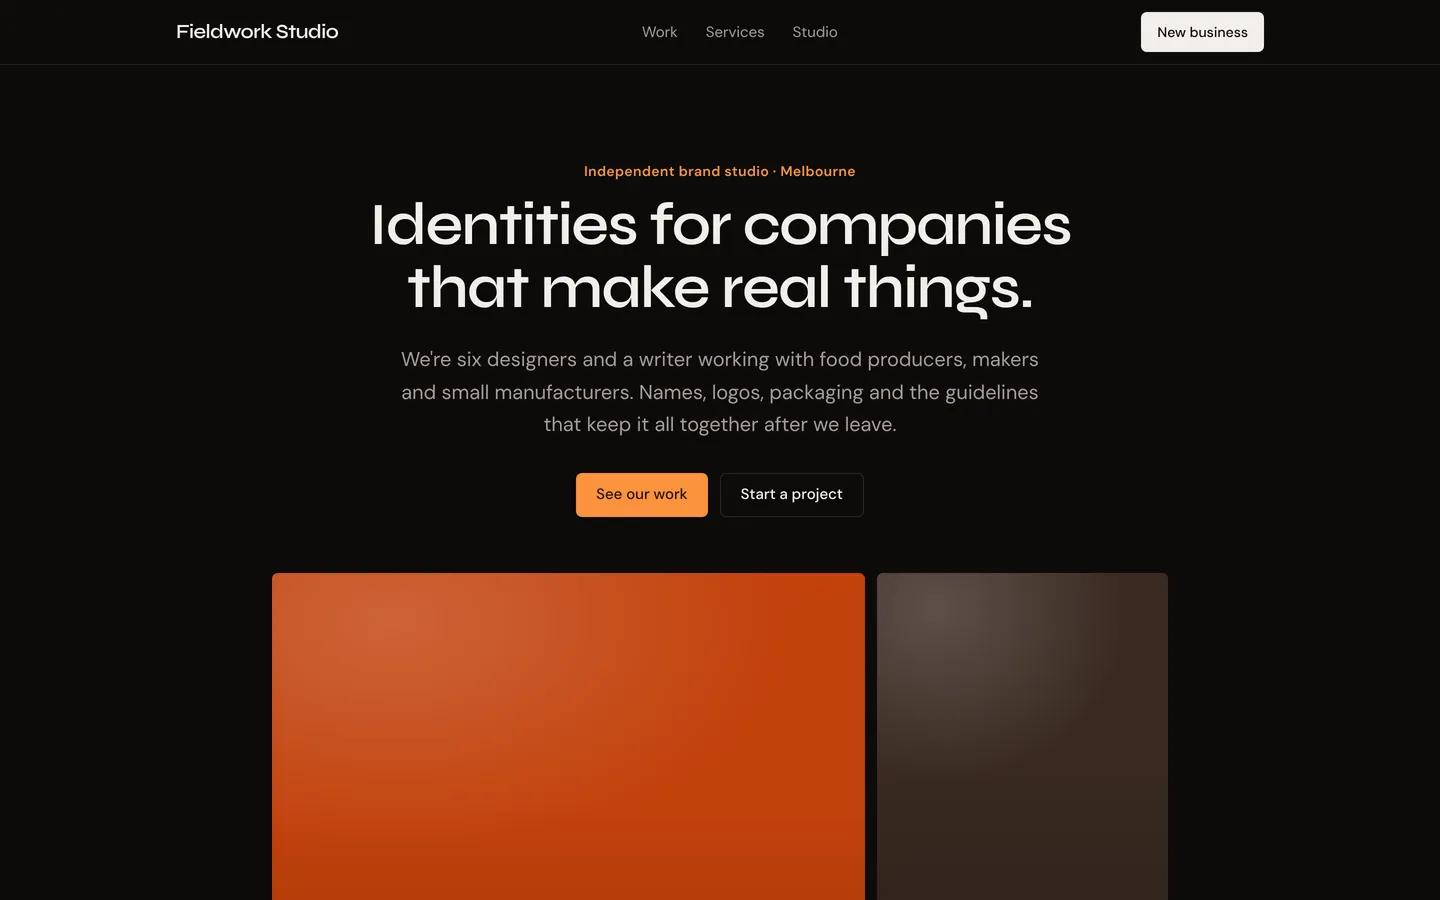
Brand design studio
Bold dark site for an independent brand and identity studio, with case work, services and team.
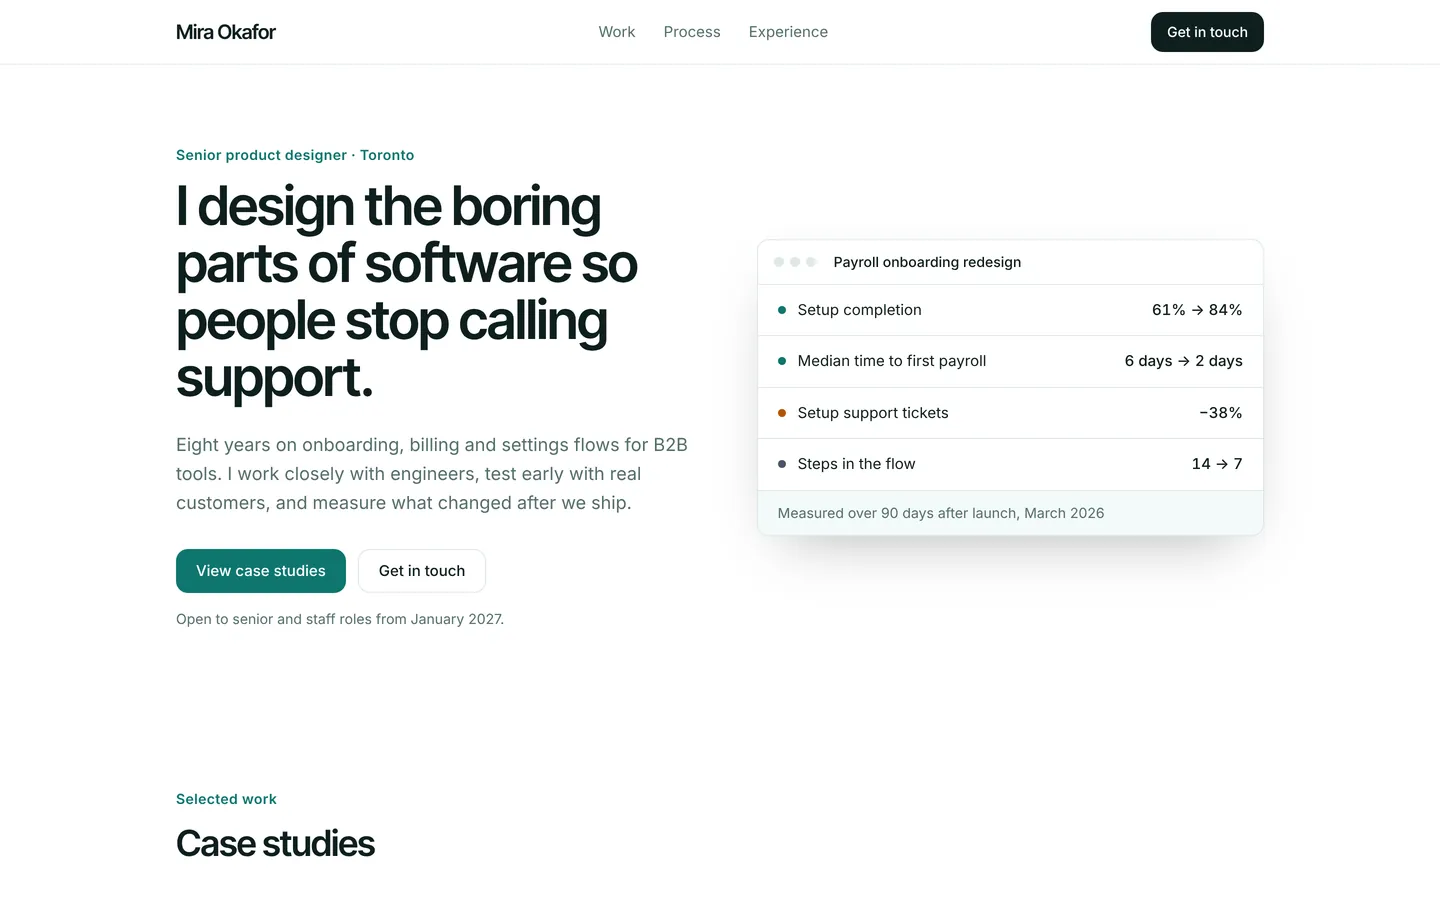
Product designer
Case-study portfolio for a product designer, with process, experience timeline and references.
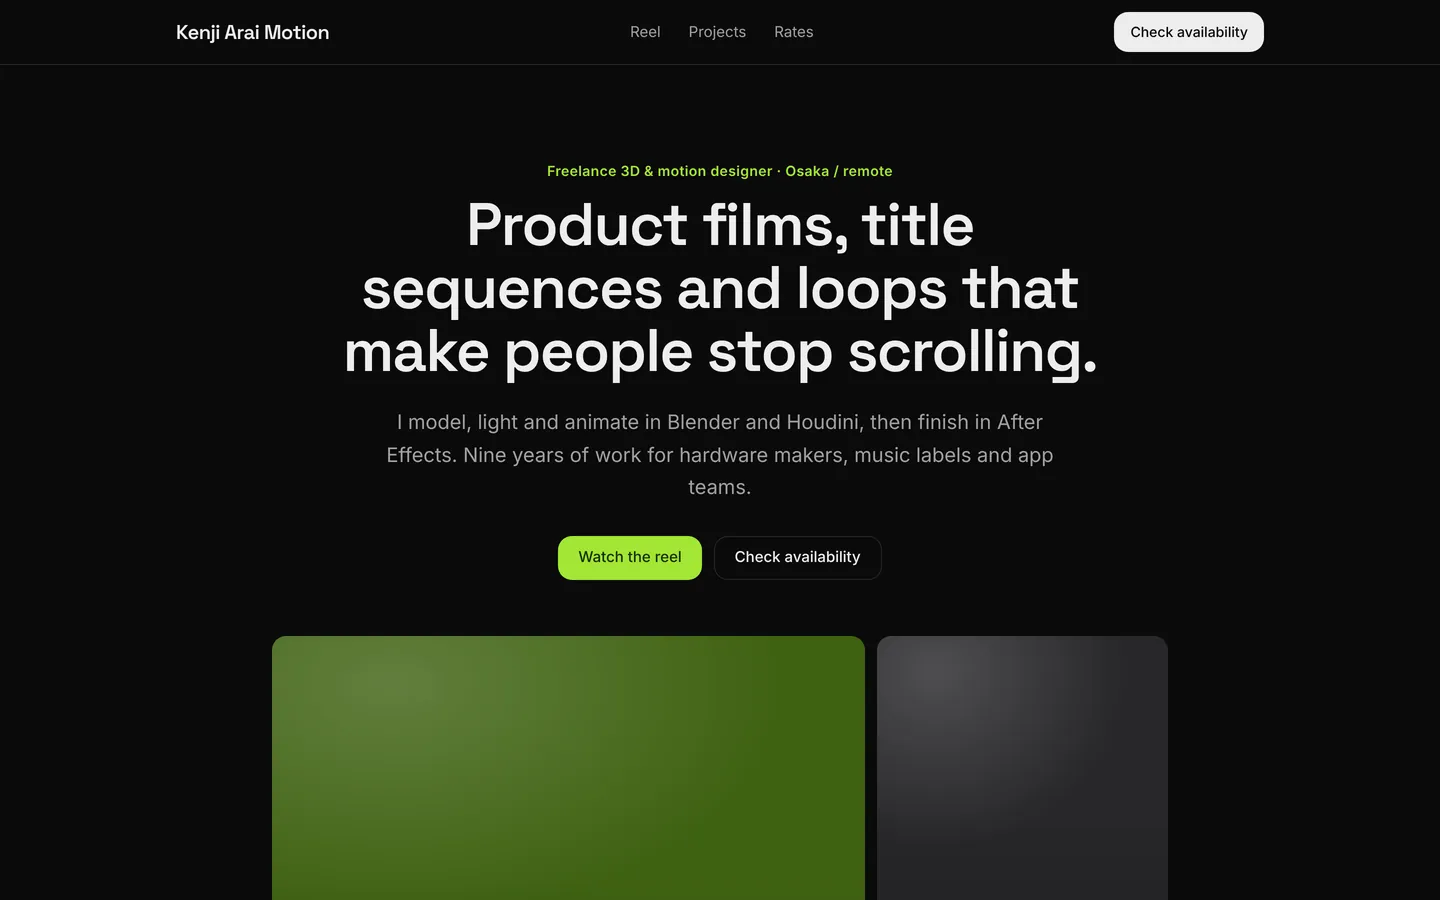
3D & motion designer
High-contrast dark portfolio for a 3D and motion designer, with reels, projects, rates and process.
Build on Data scientist
Create a free account, start from this template, and ask the AI agent to turn it into your app.